Fig. 8.
Download original image
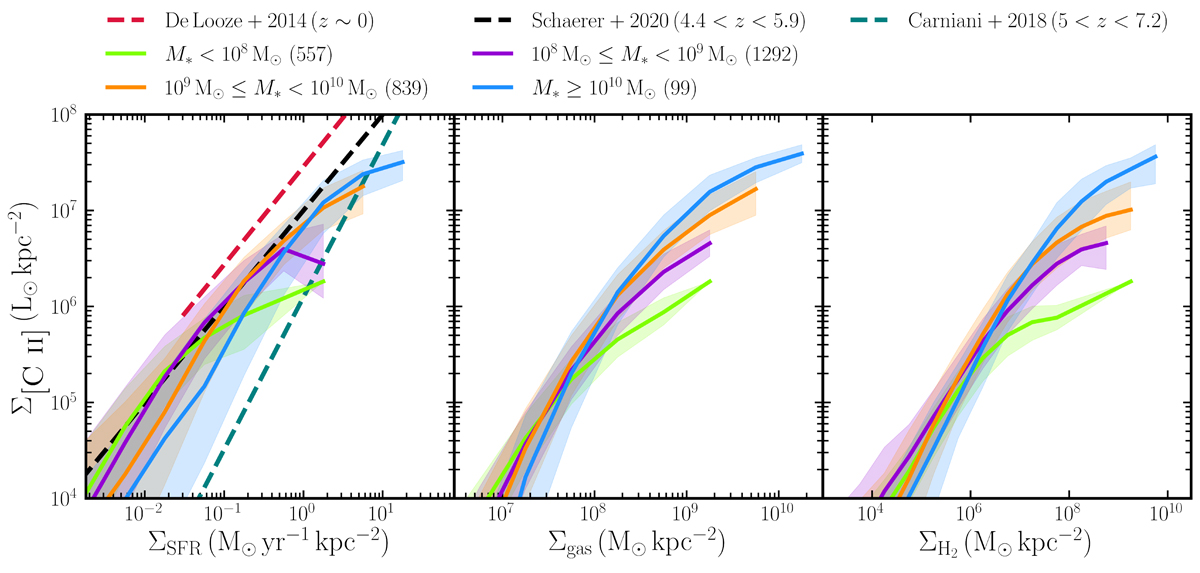
Spatially resolved ![]() relation for the MARIGOLD galaxies at z = 4. The galaxies are divided into different stellar-mass bins (the number of galaxies in each bin is indicated in the legend). The solid lines show the median
relation for the MARIGOLD galaxies at z = 4. The galaxies are divided into different stellar-mass bins (the number of galaxies in each bin is indicated in the legend). The solid lines show the median ![]() as a function of the SFR surface density (left), of the gas surface density (middle), and of the H2 surface density (right). The shaded areas represent the 16–84 percentile range. In the left panel, dashed lines indicate the empirical relations from De Looze et al. (2014, red) based on local dwarf galaxies from the Herschel Dwarf Galaxy Survey, for ALPINE galaxies in black (based on global values only Schaerer et al. 2020, black), and for a sample of galaxies at 5 < z < 7.2 from Carniani et al. (2018, teal). For the simulated galaxies, the [C II] surface brightness, and the SFR, gas, and H2 surface densities were obtained from a face-on projection of a cube centred on the galaxy and of side length equal to twice the radius of the galaxy.
as a function of the SFR surface density (left), of the gas surface density (middle), and of the H2 surface density (right). The shaded areas represent the 16–84 percentile range. In the left panel, dashed lines indicate the empirical relations from De Looze et al. (2014, red) based on local dwarf galaxies from the Herschel Dwarf Galaxy Survey, for ALPINE galaxies in black (based on global values only Schaerer et al. 2020, black), and for a sample of galaxies at 5 < z < 7.2 from Carniani et al. (2018, teal). For the simulated galaxies, the [C II] surface brightness, and the SFR, gas, and H2 surface densities were obtained from a face-on projection of a cube centred on the galaxy and of side length equal to twice the radius of the galaxy.
Current usage metrics show cumulative count of Article Views (full-text article views including HTML views, PDF and ePub downloads, according to the available data) and Abstracts Views on Vision4Press platform.
Data correspond to usage on the plateform after 2015. The current usage metrics is available 48-96 hours after online publication and is updated daily on week days.
Initial download of the metrics may take a while.