Fig. 7.
Download original image
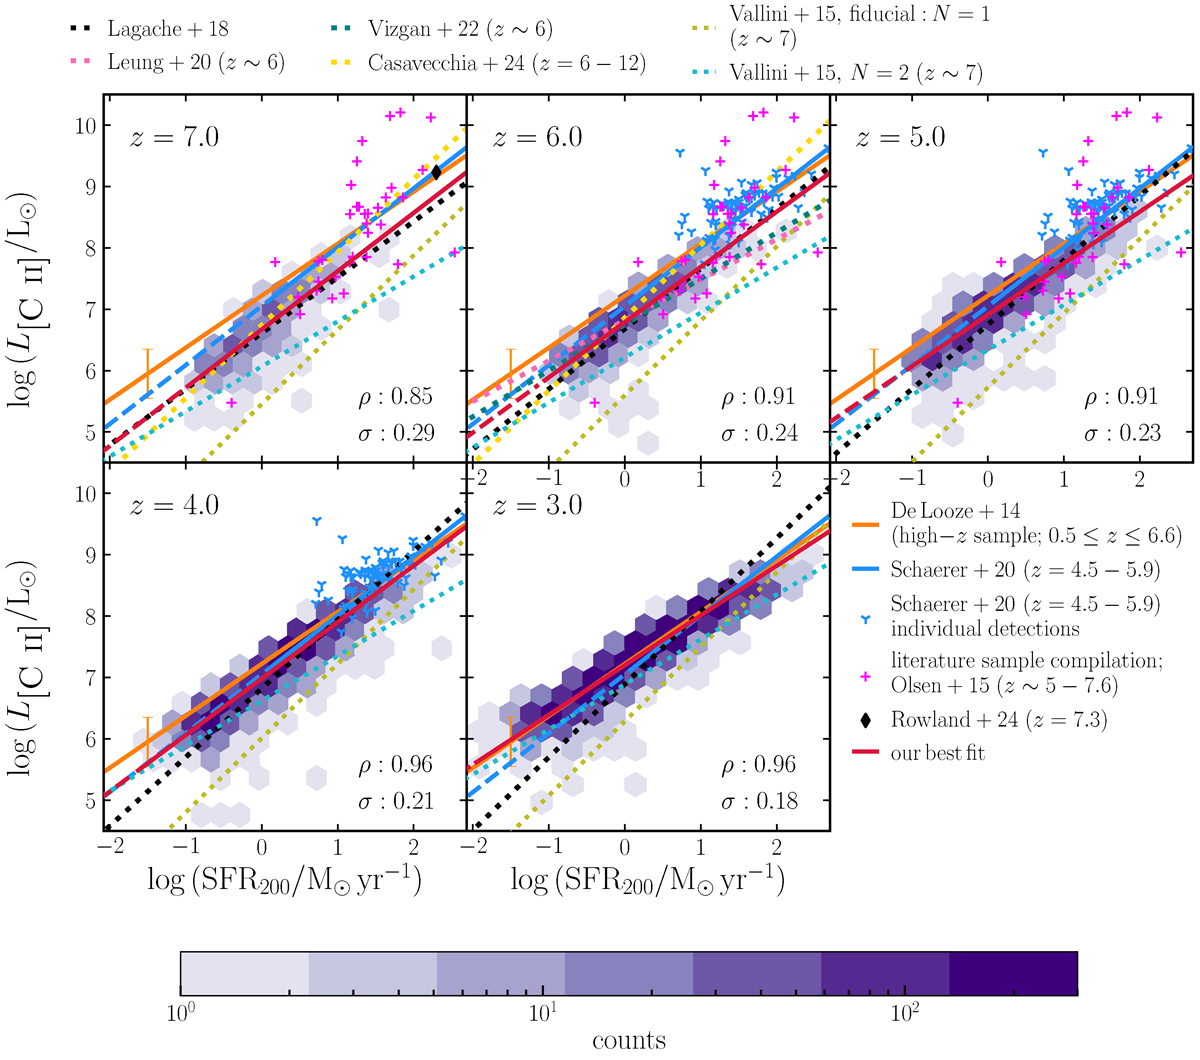
![]() relation from the MARIGOLD simulations at 3 ≤ z ≤ 7 compared with observations. The simulated galaxy population is represented as purple hexbins, with the colour indicating the galaxy counts per bin. The red line showing the best-fit to these galaxies (see Table 3 for the fit parameters). In each panel, we report the Spearman’s rank correlation coefficient (ρ) and the 1σ scatter around the best-fit relation. The best-fit relation from De Looze et al. (2014) for their high−z (0.5 < z < 6.6) sample is shown in orange, with the shaded area representing the 1σ scatter. The blue line indicates the best-fit relation for 4.5 ≲ z ≲ 5.9 galaxies from the ALPINE survey (Schaerer et al. 2020). The best-fits mentioned above are extrapolated beyond the range constrained by the respective studies using a dashed line of the same colour. The individual ALPINE galaxies (at 4.5 ≲ z ≲ 5.9), the literature sample (at 5 ≲ z ≲ 7.6) taken from Olsen et al. (2015), and REBELS-25 from the REBELS survey Rowland et al. (2024) are shown with blue, pink, and black symbols, respectively. The relations from other simulations are shown as dotted lines. The relations from Lagache et al. (2018) at the respective redshift are shown in grey. The olive and cyan dotted lines along with the scatter represent the Vallini et al. (2015) relations with N = 1 and N = 3, respectively for the Kennicutt–Schmidt relation. In both cases we show the relation assuming the median Zgas of our simulated galaxies at a given redshift. The pink and teal lines represent the relations from Leung et al. (2020) and Vizgan et al. (2022), respectively, both obtained by post-processing the z ∼ 6 snapshot of the SIMBA simulations (Davé et al. 2020) with different versions of SíGAME (Olsen et al. 2015, 2017). The grey line represents the relation from Casavecchia et al. (2024).
relation from the MARIGOLD simulations at 3 ≤ z ≤ 7 compared with observations. The simulated galaxy population is represented as purple hexbins, with the colour indicating the galaxy counts per bin. The red line showing the best-fit to these galaxies (see Table 3 for the fit parameters). In each panel, we report the Spearman’s rank correlation coefficient (ρ) and the 1σ scatter around the best-fit relation. The best-fit relation from De Looze et al. (2014) for their high−z (0.5 < z < 6.6) sample is shown in orange, with the shaded area representing the 1σ scatter. The blue line indicates the best-fit relation for 4.5 ≲ z ≲ 5.9 galaxies from the ALPINE survey (Schaerer et al. 2020). The best-fits mentioned above are extrapolated beyond the range constrained by the respective studies using a dashed line of the same colour. The individual ALPINE galaxies (at 4.5 ≲ z ≲ 5.9), the literature sample (at 5 ≲ z ≲ 7.6) taken from Olsen et al. (2015), and REBELS-25 from the REBELS survey Rowland et al. (2024) are shown with blue, pink, and black symbols, respectively. The relations from other simulations are shown as dotted lines. The relations from Lagache et al. (2018) at the respective redshift are shown in grey. The olive and cyan dotted lines along with the scatter represent the Vallini et al. (2015) relations with N = 1 and N = 3, respectively for the Kennicutt–Schmidt relation. In both cases we show the relation assuming the median Zgas of our simulated galaxies at a given redshift. The pink and teal lines represent the relations from Leung et al. (2020) and Vizgan et al. (2022), respectively, both obtained by post-processing the z ∼ 6 snapshot of the SIMBA simulations (Davé et al. 2020) with different versions of SíGAME (Olsen et al. 2015, 2017). The grey line represents the relation from Casavecchia et al. (2024).
Current usage metrics show cumulative count of Article Views (full-text article views including HTML views, PDF and ePub downloads, according to the available data) and Abstracts Views on Vision4Press platform.
Data correspond to usage on the plateform after 2015. The current usage metrics is available 48-96 hours after online publication and is updated daily on week days.
Initial download of the metrics may take a while.