Fig. 3.
Download original image
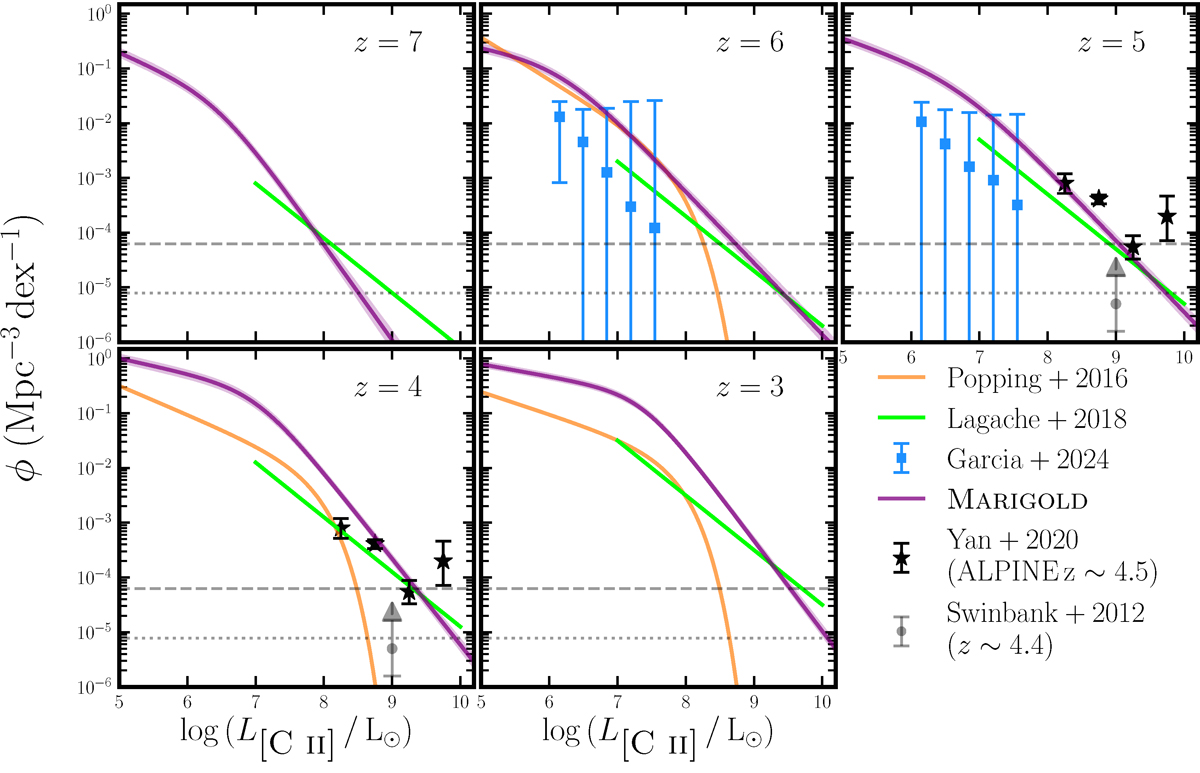
Simulated [C II] LF compared with observational estimates. The coloured lines represent the best-fit DPL – Eq. (2) – to the simulated LF and the shaded area represents the central 68% credibility range obtained using the MCMC chains. Black stars represent the observational estimates at z ∼ 4.5 from the ALPINE survey (Yan et al. 2020) and the grey arrow shows the lower limit from Swinbank et al. (2012) based on observations of two galaxies at z ∼ 4.4. The dashed and dotted horizontal lines represent a number count of 1 per dex in the entire simulation volume of M25 and M50, respectively. The [C II] LF from Popping et al. (2016) and Lagache et al. (2018) both based on a semi-analytical galaxy formation model, and from Garcia et al. (2024) obtained by post-processing the SIMBA simulations at z = 6 and 5 are included in the respective panels.
Current usage metrics show cumulative count of Article Views (full-text article views including HTML views, PDF and ePub downloads, according to the available data) and Abstracts Views on Vision4Press platform.
Data correspond to usage on the plateform after 2015. The current usage metrics is available 48-96 hours after online publication and is updated daily on week days.
Initial download of the metrics may take a while.