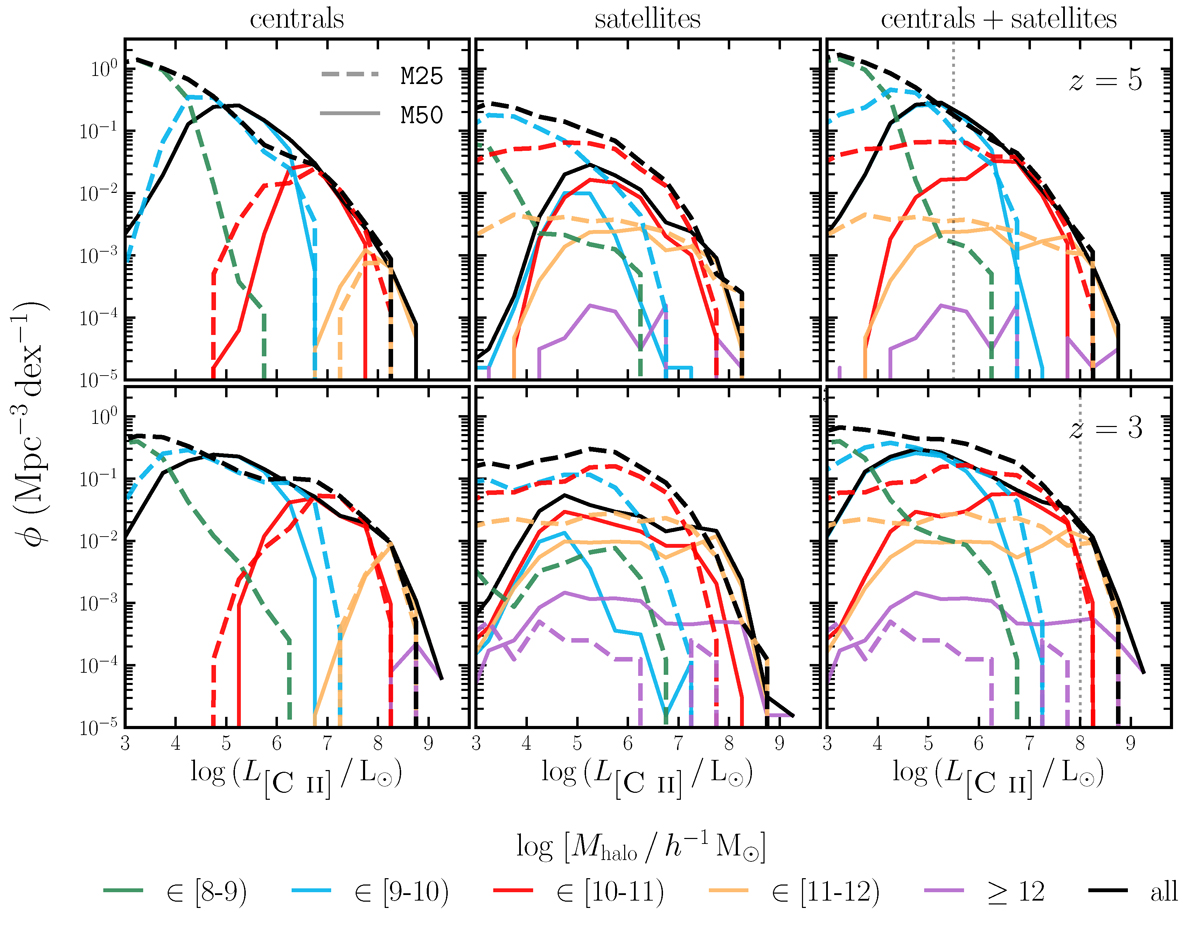
Fig. 2.
Download original image
Conditional [C II] LF from the M25 (dashed lines) and M50 (solid lines) simulations at redshifts z = 5 and 3 for central galaxies (left panels), satellites galaxies (middle panels), and all galaxies (right panels). The coloured lines show the CLF of emitters residing in DM halos in different Mhalo bins and the black lines show the total LFs. The dotted grey line in the right panels denotes the luminosity threshold, Lthr, below which the total LFs from two simulations differ significantly due to resolution effects.
Current usage metrics show cumulative count of Article Views (full-text article views including HTML views, PDF and ePub downloads, according to the available data) and Abstracts Views on Vision4Press platform.
Data correspond to usage on the plateform after 2015. The current usage metrics is available 48-96 hours after online publication and is updated daily on week days.
Initial download of the metrics may take a while.