Fig. C.1.
Download original image
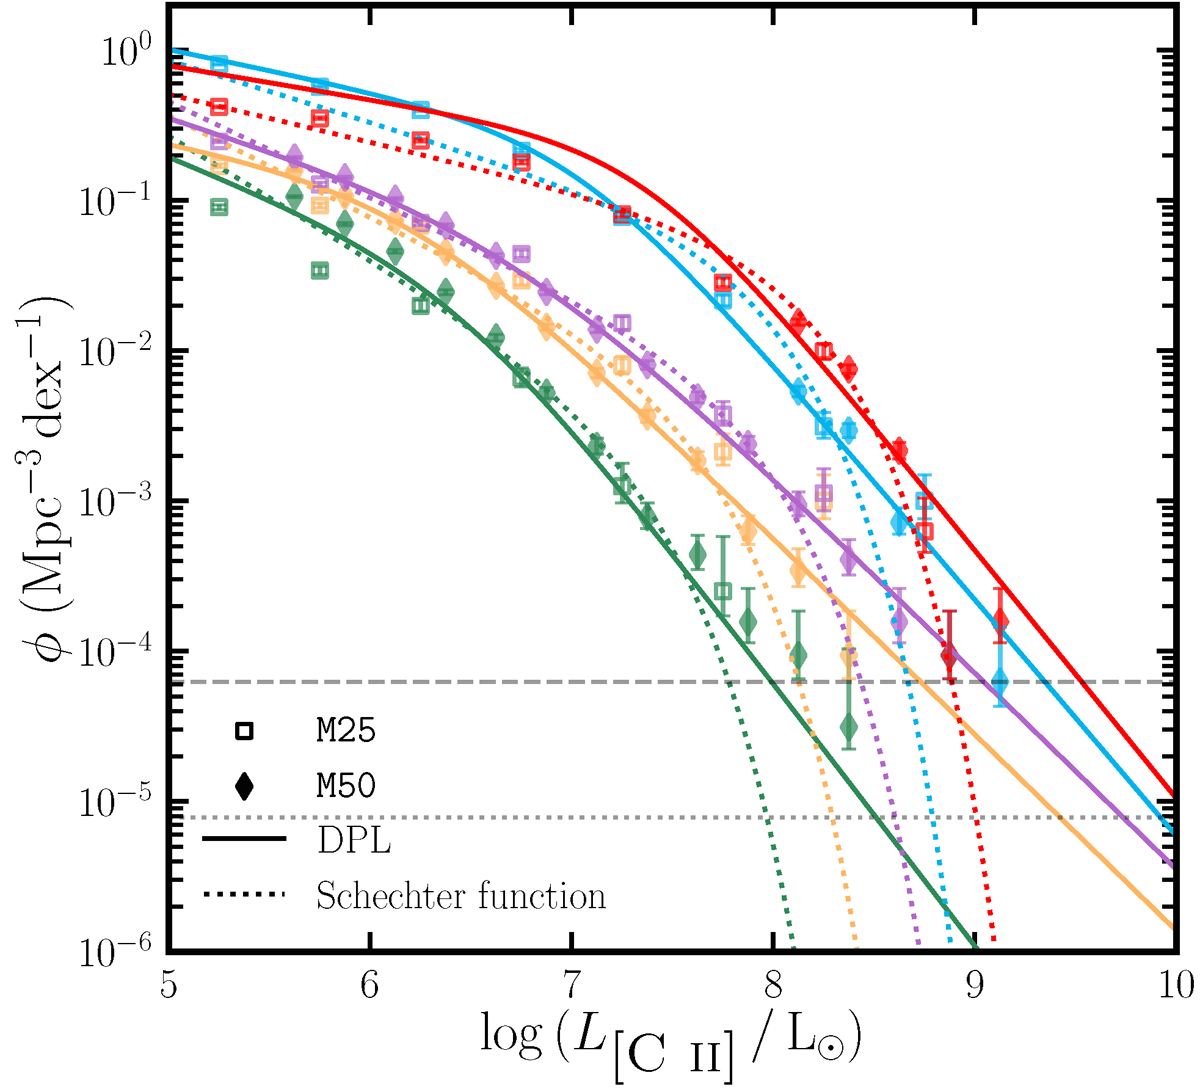
Comparison of the Schechter function (dotted lines) and DPL (solid lines) fits to our simulated LFs from the two simulations at different redshifts (from top to bottom, z increases from 3 to 7). The open squares and diamonds represent the separate LFs from the simulations that are used to obtain the fit parameters using an MCMC analysis. The error bars represent the 16 CL upper and lower Poisson uncertainties on number counts (Gehrels 1986). The dashed and dotted horizontal lines represent a number count of 1 per dex in the entire simulation volume of M25 and M50, respectively.
Current usage metrics show cumulative count of Article Views (full-text article views including HTML views, PDF and ePub downloads, according to the available data) and Abstracts Views on Vision4Press platform.
Data correspond to usage on the plateform after 2015. The current usage metrics is available 48-96 hours after online publication and is updated daily on week days.
Initial download of the metrics may take a while.