Fig. 16.
Download original image
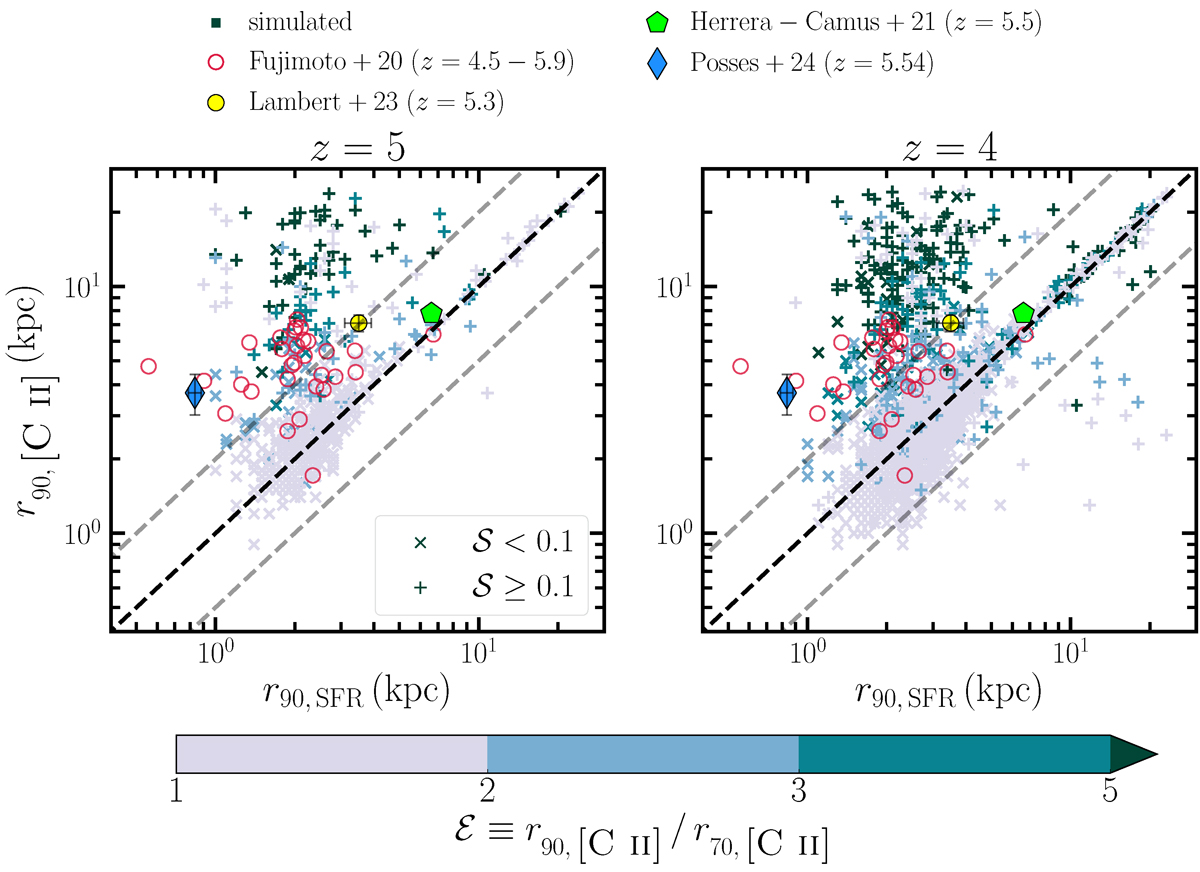
Comparison of ![]() and r90, SFR for simulated galaxies at redshifts z = 5 (left) and 4 (right). The galaxies are colour-coded by their multicomponent extent parameter ℰ defined as the ratio of the r90 and r70 values of the [C II] surface brightness profile. The shape of the symbol reflects the 𝒮 parameter that quantifies the satellite contribution to the total [C II] emission (see text for details). We use ‘low 𝒮’ and ‘high 𝒮’, respectively to denote galaxies with < 10% and ≥10% satellite contribution. The
and r90, SFR for simulated galaxies at redshifts z = 5 (left) and 4 (right). The galaxies are colour-coded by their multicomponent extent parameter ℰ defined as the ratio of the r90 and r70 values of the [C II] surface brightness profile. The shape of the symbol reflects the 𝒮 parameter that quantifies the satellite contribution to the total [C II] emission (see text for details). We use ‘low 𝒮’ and ‘high 𝒮’, respectively to denote galaxies with < 10% and ≥10% satellite contribution. The ![]() versus r90, SFR values of observed galaxies are shown as red open circles (Fujimoto et al. 2020), a yellow plus (Lambert et al. 2023), a green pentagon (Herrera-Camus et al. 2021), and a blue diamond (Posses et al. 2024). The black dashed line indicates a 1:1 relation, while the top and bottom grey dashed lines indicate 2:1 and 1:2 relations, respectively. Note that the error bars are not shown for Fujimoto et al. (2020) galaxies for the sake of clarity.
versus r90, SFR values of observed galaxies are shown as red open circles (Fujimoto et al. 2020), a yellow plus (Lambert et al. 2023), a green pentagon (Herrera-Camus et al. 2021), and a blue diamond (Posses et al. 2024). The black dashed line indicates a 1:1 relation, while the top and bottom grey dashed lines indicate 2:1 and 1:2 relations, respectively. Note that the error bars are not shown for Fujimoto et al. (2020) galaxies for the sake of clarity.
Current usage metrics show cumulative count of Article Views (full-text article views including HTML views, PDF and ePub downloads, according to the available data) and Abstracts Views on Vision4Press platform.
Data correspond to usage on the plateform after 2015. The current usage metrics is available 48-96 hours after online publication and is updated daily on week days.
Initial download of the metrics may take a while.