Fig. 14.
Download original image
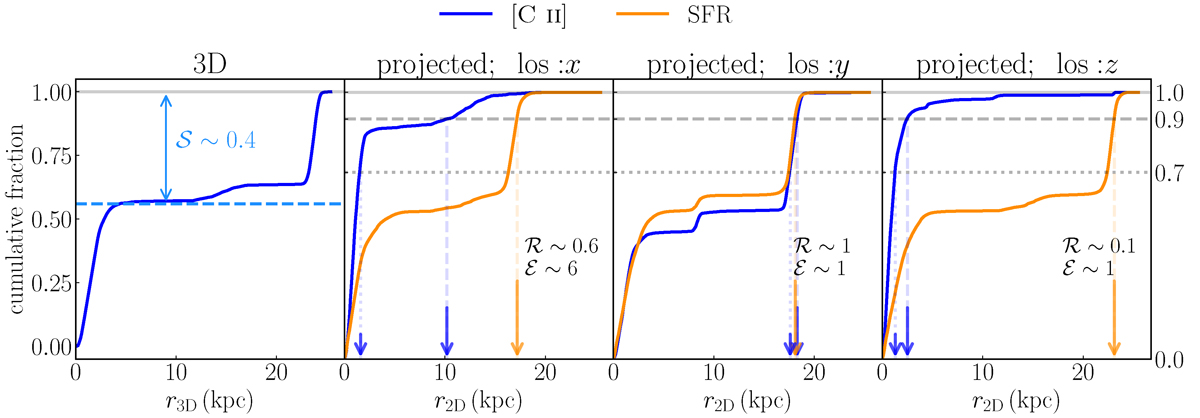
Example illustrating the calculation of the 𝒮, ℛ, and ℰ parameters in a simulated galaxy. The left panel shows the cumulative profile for the 3D distribution of [C II], with the dashed line marks the contribution of the central galaxy to the total [C II] emission (as evident from the flattening of the cumulative profile). The remaining fraction (denoted by 𝒮) represents the contribution of satellites. The other panels show cumulative profile constructed from the [C II] surface brightness (blue) and SFR surface density (orange). For the profiles obtained from projections, the value of the ℛ and ℰ parameters are indicated in each panel. In all but the leftmost panel, the dotted, dashed and solid horizontal lines denote cumulative fractions of 70%, 90%, and 100%, respectively. The small and large blue arrows mark ![]() and
and ![]() , respectively and the orange arrow denotes r90, SFR. The parameter
, respectively and the orange arrow denotes r90, SFR. The parameter ![]() is calculated from the ratio of the r values denoted by the large blue and orange arrows, while the parameter
is calculated from the ratio of the r values denoted by the large blue and orange arrows, while the parameter ![]() from the ratio of the large and small blue arrows.
from the ratio of the large and small blue arrows.
Current usage metrics show cumulative count of Article Views (full-text article views including HTML views, PDF and ePub downloads, according to the available data) and Abstracts Views on Vision4Press platform.
Data correspond to usage on the plateform after 2015. The current usage metrics is available 48-96 hours after online publication and is updated daily on week days.
Initial download of the metrics may take a while.