Fig. 13.
Download original image
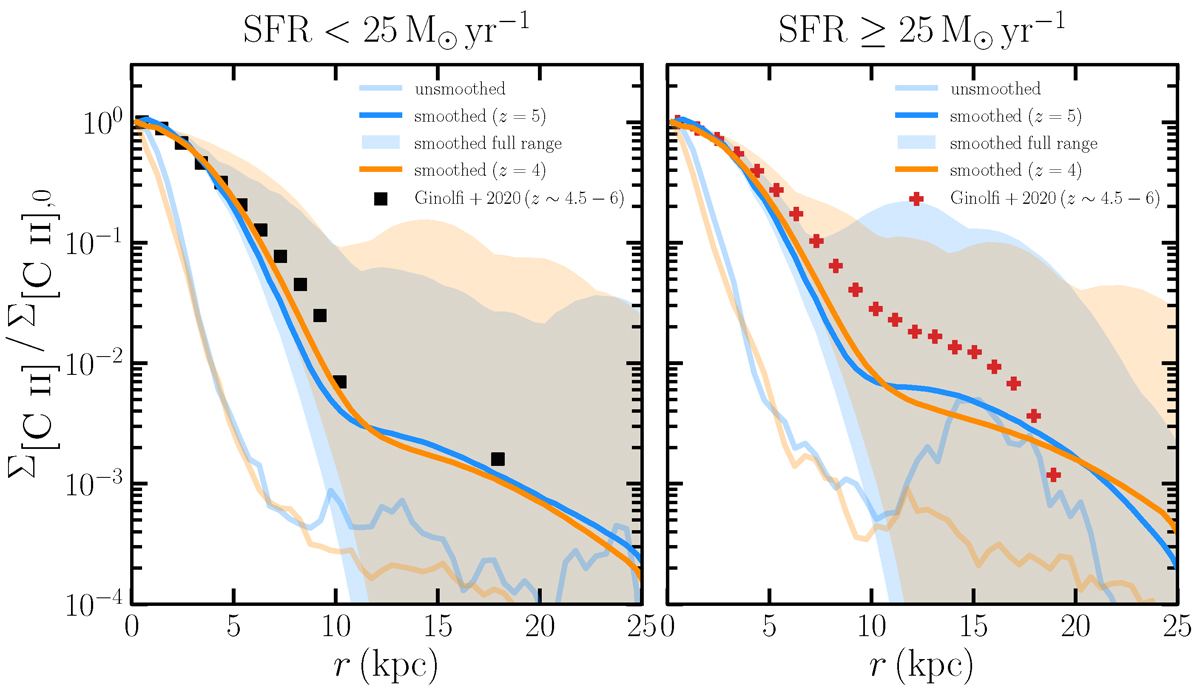
Comparison of the simulated and observed stacked (radial) surface brightness profiles of the [C II] emission. The left and right panels show, respectively, the stacked surface density profiles for the low-SFR (SFR < 25 M⊙ yr−1) and high-SFR (SFR ≥ 25 M⊙ yr−1) samples as defined by Ginolfi et al. (2020) based on galaxies from the ALPINE survey at z = 4.5 − 5.9. The solid lines represent the stacked profiles of (central) galaxies from the simulation at z = 5 (in blue) and z = 4 (in orange). The shaded areas represent the full range spanned by the individual profiles, which were constructed from the 2D projection of a 50 kpc cube centred on the galaxy along three orthogonal lines of sight. All profiles were smoothed with a 2D Gaussian beam of FWHM 0.9″ (as in Ginolfi et al. 2020) and normalised by the peak value of the stack. For reference, the unsmoothed stacked profiles are shown in lighter shades. The observed profiles from Ginolfi et al. (2020) are shown in black squares and red plusses for their low- and high-SFR samples, respectively.
Current usage metrics show cumulative count of Article Views (full-text article views including HTML views, PDF and ePub downloads, according to the available data) and Abstracts Views on Vision4Press platform.
Data correspond to usage on the plateform after 2015. The current usage metrics is available 48-96 hours after online publication and is updated daily on week days.
Initial download of the metrics may take a while.