Fig. 11.
Download original image
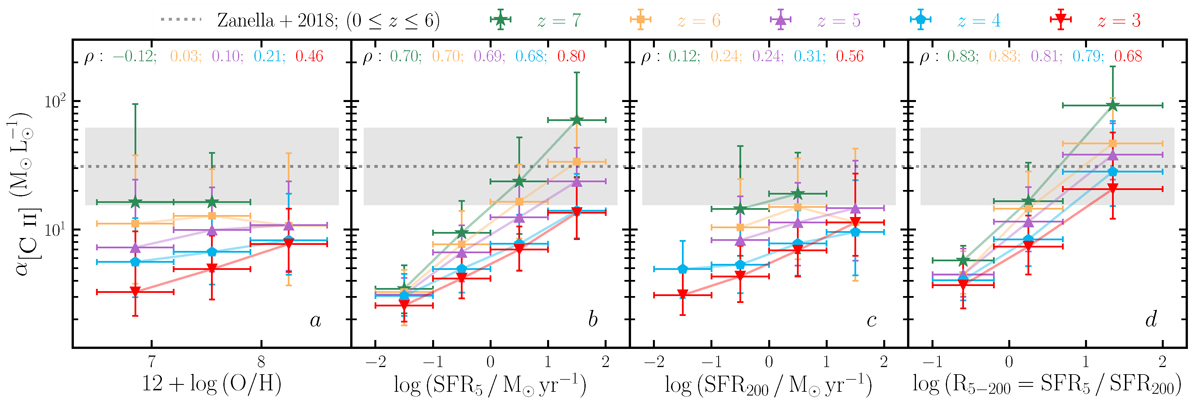
Conversion factor α[C II] in our simulated galaxies as a function of gas metallicity (panel a), the SFR averaged over the last 5 Myr (panel b), the SFR averaged over the last 200 Myr (panel c), and the SFR change diagnostic R5 − 200 (panel d, see text) at different redshifts. The coloured symbols represent the median α[C II] in each bin, while the error bars represent the 16–84 percentiles. The Spearman’s rank correlation coefficient between the variables on the y and x axes are shown in each panel as well. The grey dotted line denotes the mean α[C II] from Zanella et al. (2018) and the shaded band represents the corresponding scatter.
Current usage metrics show cumulative count of Article Views (full-text article views including HTML views, PDF and ePub downloads, according to the available data) and Abstracts Views on Vision4Press platform.
Data correspond to usage on the plateform after 2015. The current usage metrics is available 48-96 hours after online publication and is updated daily on week days.
Initial download of the metrics may take a while.