Fig. 8
Download original image
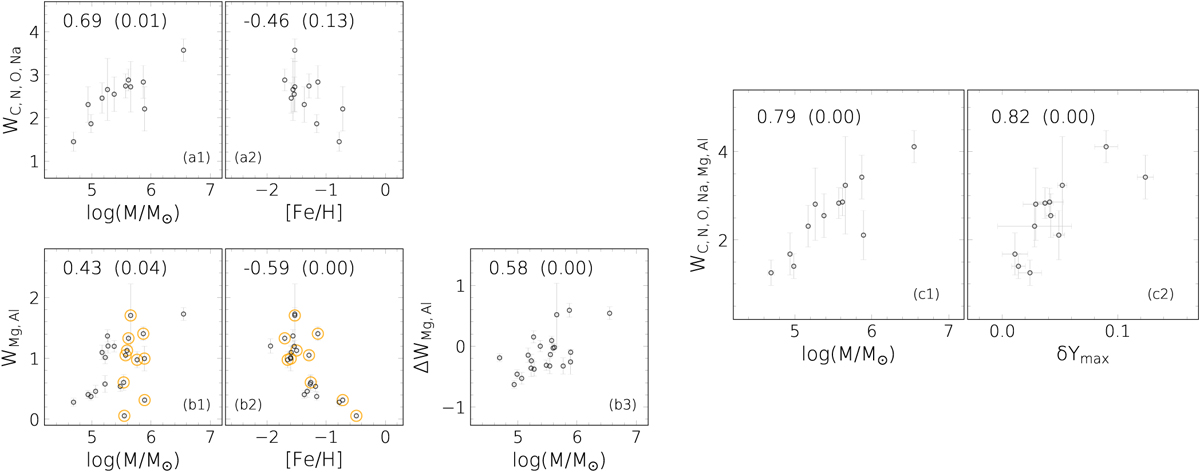
Panels (a1) and (a2): WC,N,O,Na vs. log(M/M⊙) and [Fe/H], respectively. Panels (b1) and (b2): same as panels (a1) and (a2) but for WMg,Al. GCs within the 5.5 < log(M/M⊙) < 5.9 mass interval used to remove the metallicity dependence (see text for details) are encircled in yellow. Panel (b3): resulting width after removing [Fe/H] dependence (ΔWMg,Al) vs. mass. Panels (c1) and (c2): total width of light elements involved in the multiple population phenomenon WC,N,O,Na,Mg,Al vs. mass and maximum helium spread measured by Milone et al. (2018), respectively. The Spearman correlation coefficient and its p-value are reported in each plot as in Figure 7.
Current usage metrics show cumulative count of Article Views (full-text article views including HTML views, PDF and ePub downloads, according to the available data) and Abstracts Views on Vision4Press platform.
Data correspond to usage on the plateform after 2015. The current usage metrics is available 48-96 hours after online publication and is updated daily on week days.
Initial download of the metrics may take a while.