Fig. 6
Download original image
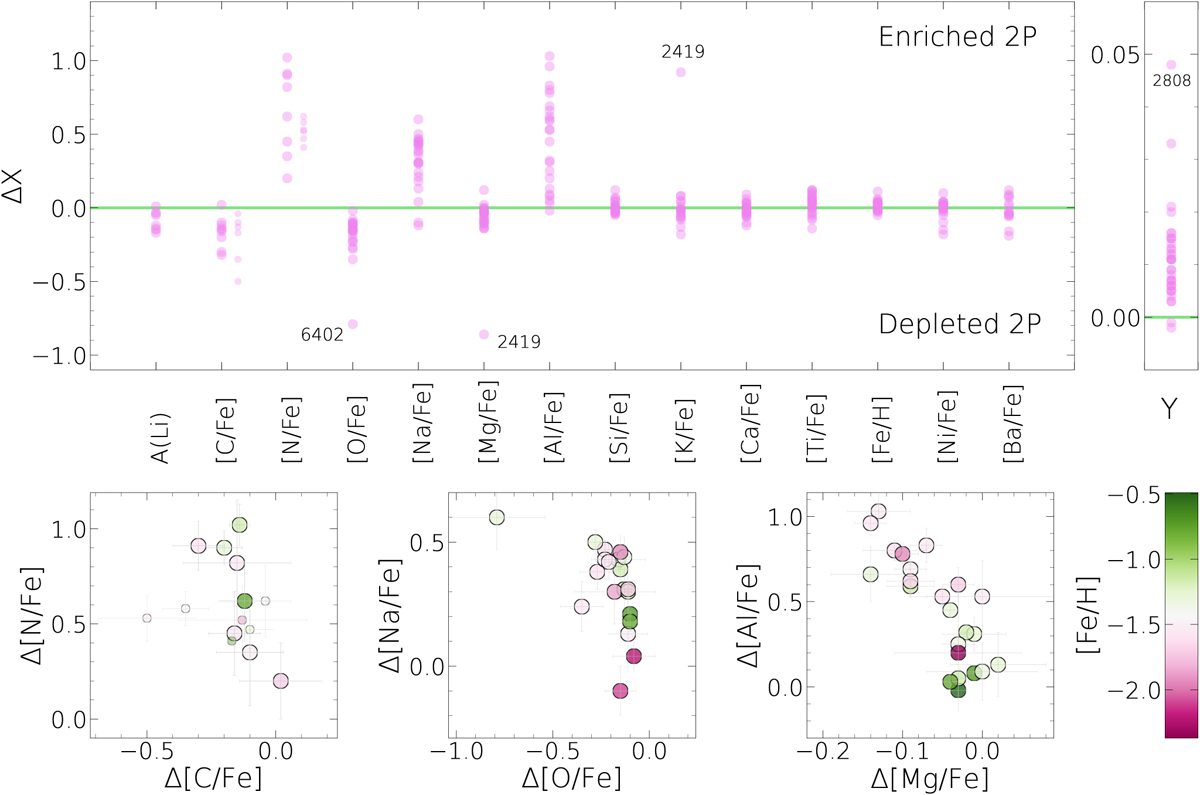
Upper panels: difference between the median of the 2P and 1P abundance of each analyzed element. Positive and negative values (above and below the green line), represent enrichment and depletion of 2P stars, respectively. The right panel displays the 2P–1P helium difference (in mass fraction) from Milone et al. (2018). Lower panels: diagrams of Δ[N/Fe] vs. Δ[C/Fe] (left), Δ[Na/Fe] vs. Δ[O/Fe] (middle), and Δ[Al/Fe] vs. Δ[Mg/Fe] (right). Each point is color coded according to their [Fe/H], following the scheme represented in the color bar. Smaller dots indicate Δ[C/Fe] and Δ[N/Fe] based on RGB stars above the bump.
Current usage metrics show cumulative count of Article Views (full-text article views including HTML views, PDF and ePub downloads, according to the available data) and Abstracts Views on Vision4Press platform.
Data correspond to usage on the plateform after 2015. The current usage metrics is available 48-96 hours after online publication and is updated daily on week days.
Initial download of the metrics may take a while.