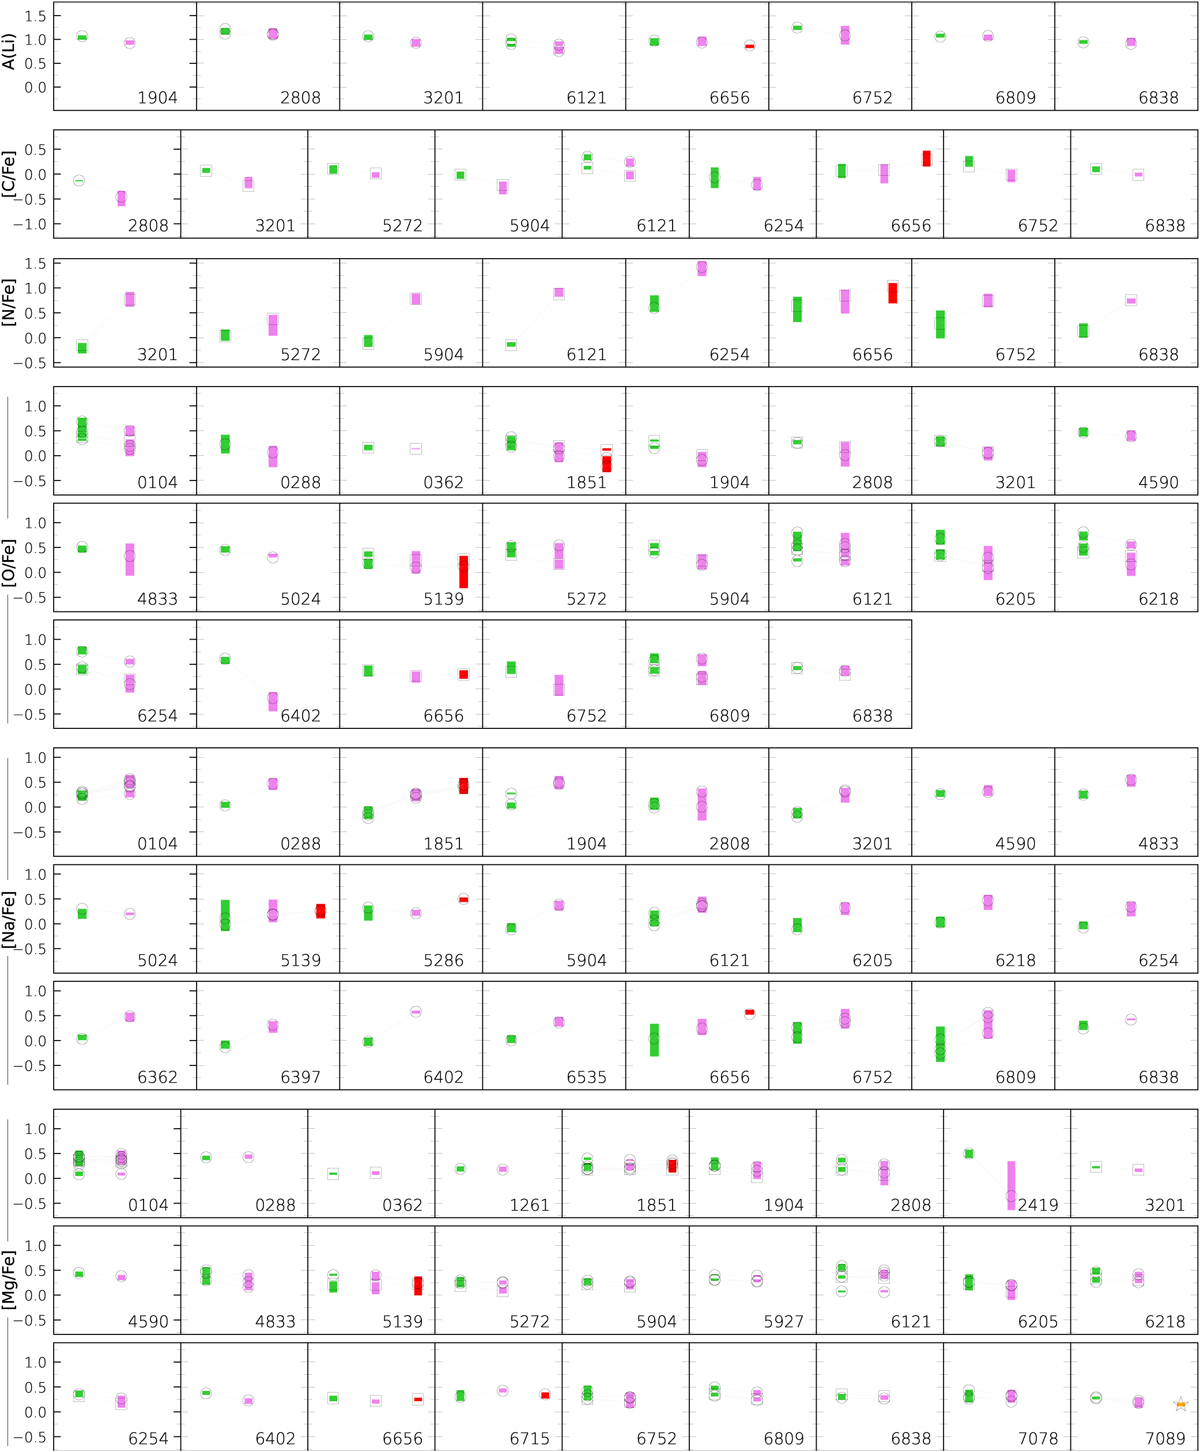
Fig. A.3
Download original image
Median abundances (open dots) of lithium, carbon, nitrogen, oxygen, sodium, and magnesium for the different populations identified in our sample of GCs with at least four stars with both photometric tagging and spectroscopic abundances. The open squares highlight APOGEE measurements. The vertical bands represent the interquartile range, and are color coded following the prescriptions introduced in Figure 1. Median values from the same spectroscopic dataset are connected by gray lines.
Current usage metrics show cumulative count of Article Views (full-text article views including HTML views, PDF and ePub downloads, according to the available data) and Abstracts Views on Vision4Press platform.
Data correspond to usage on the plateform after 2015. The current usage metrics is available 48-96 hours after online publication and is updated daily on week days.
Initial download of the metrics may take a while.