Fig. 2
Download original image
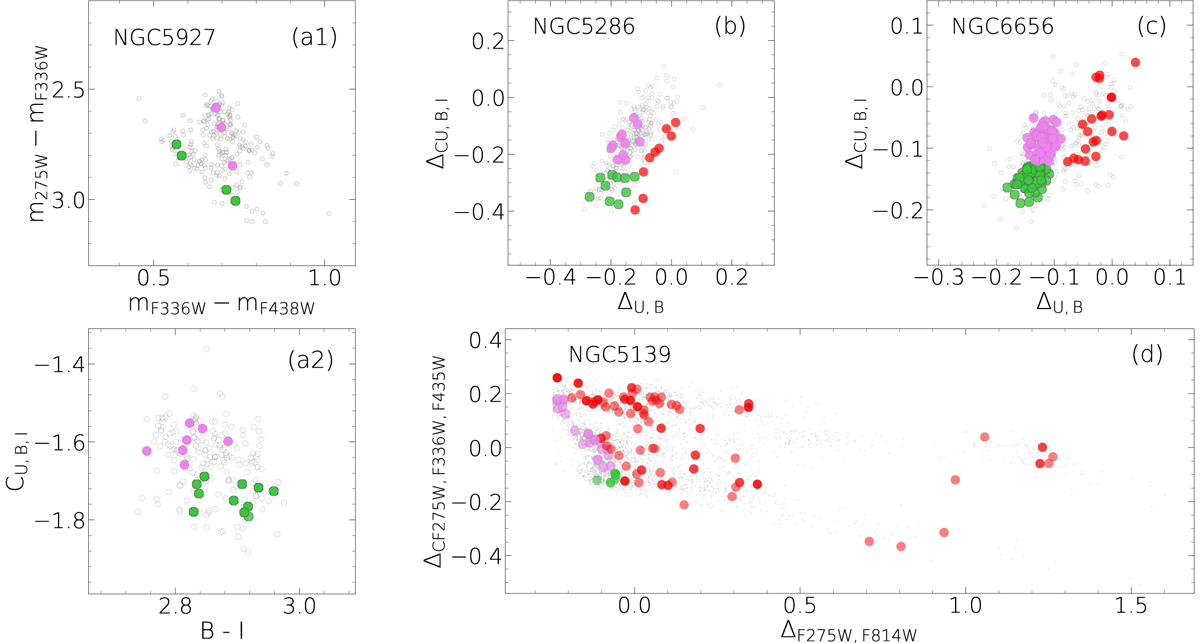
Summary of the photometric diagrams introduced in Section 3.1. Panel (a1) and (a2): two-color diagram of mF275W-mF336W vs. mF336W-mF438W and CU,B,I vs. B − I pseudo two-color diagram for the red HB of NGC 5927. Panel (b): ΔCU,B,I vs. ΔU,B ChM of NGC 5286. Panel (c): same but for NGC 6656. Panel (d): ΔCF275W,F336W,F435W vs. ΔF275W,F814W ChM of ωCen derived from the catalog by Häberle et al. (2024). Green, violet, and red dots represent 1P, 2P, and anomalous stars, respectively.
Current usage metrics show cumulative count of Article Views (full-text article views including HTML views, PDF and ePub downloads, according to the available data) and Abstracts Views on Vision4Press platform.
Data correspond to usage on the plateform after 2015. The current usage metrics is available 48-96 hours after online publication and is updated daily on week days.
Initial download of the metrics may take a while.