Fig. 3
Download original image
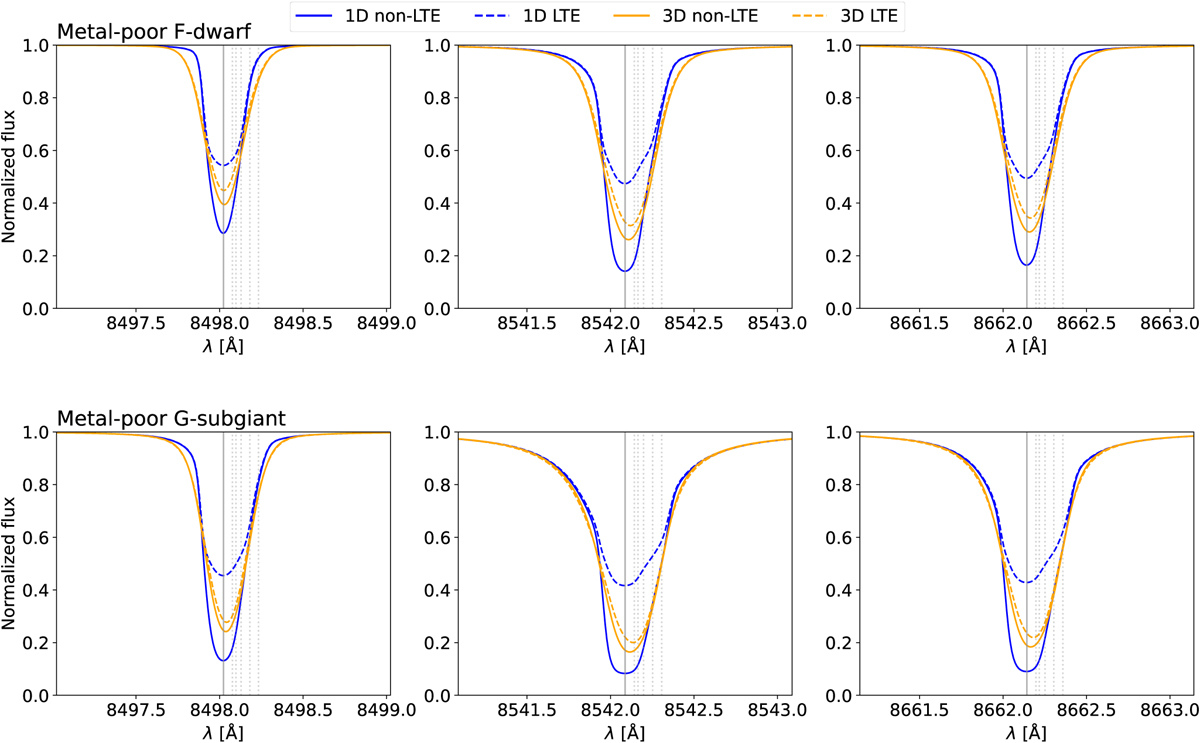
CaT lines in 1/3D (non-)LTE. The line centre wavelengths are shown for the dominant isotope (solid grey) and other isotopes (dotted grey). Top panel: metal-poor dwarf with stellar parameters Teff = 6500 K, log g = 4.0, and [Fe/H] = −3. Bottom panel: metal-poor subgiant with stellar parameters Teff = 5500 K, log g = 3.0, and [Fe/H] = −3. All spectra is computed at an abundance corresponding to [Ca/Fe] = +0.4, microturbulence ξmic. = 1.5 kms−1 (for the 1D synthesis) and no macroturbulent broadening.
Current usage metrics show cumulative count of Article Views (full-text article views including HTML views, PDF and ePub downloads, according to the available data) and Abstracts Views on Vision4Press platform.
Data correspond to usage on the plateform after 2015. The current usage metrics is available 48-96 hours after online publication and is updated daily on week days.
Initial download of the metrics may take a while.