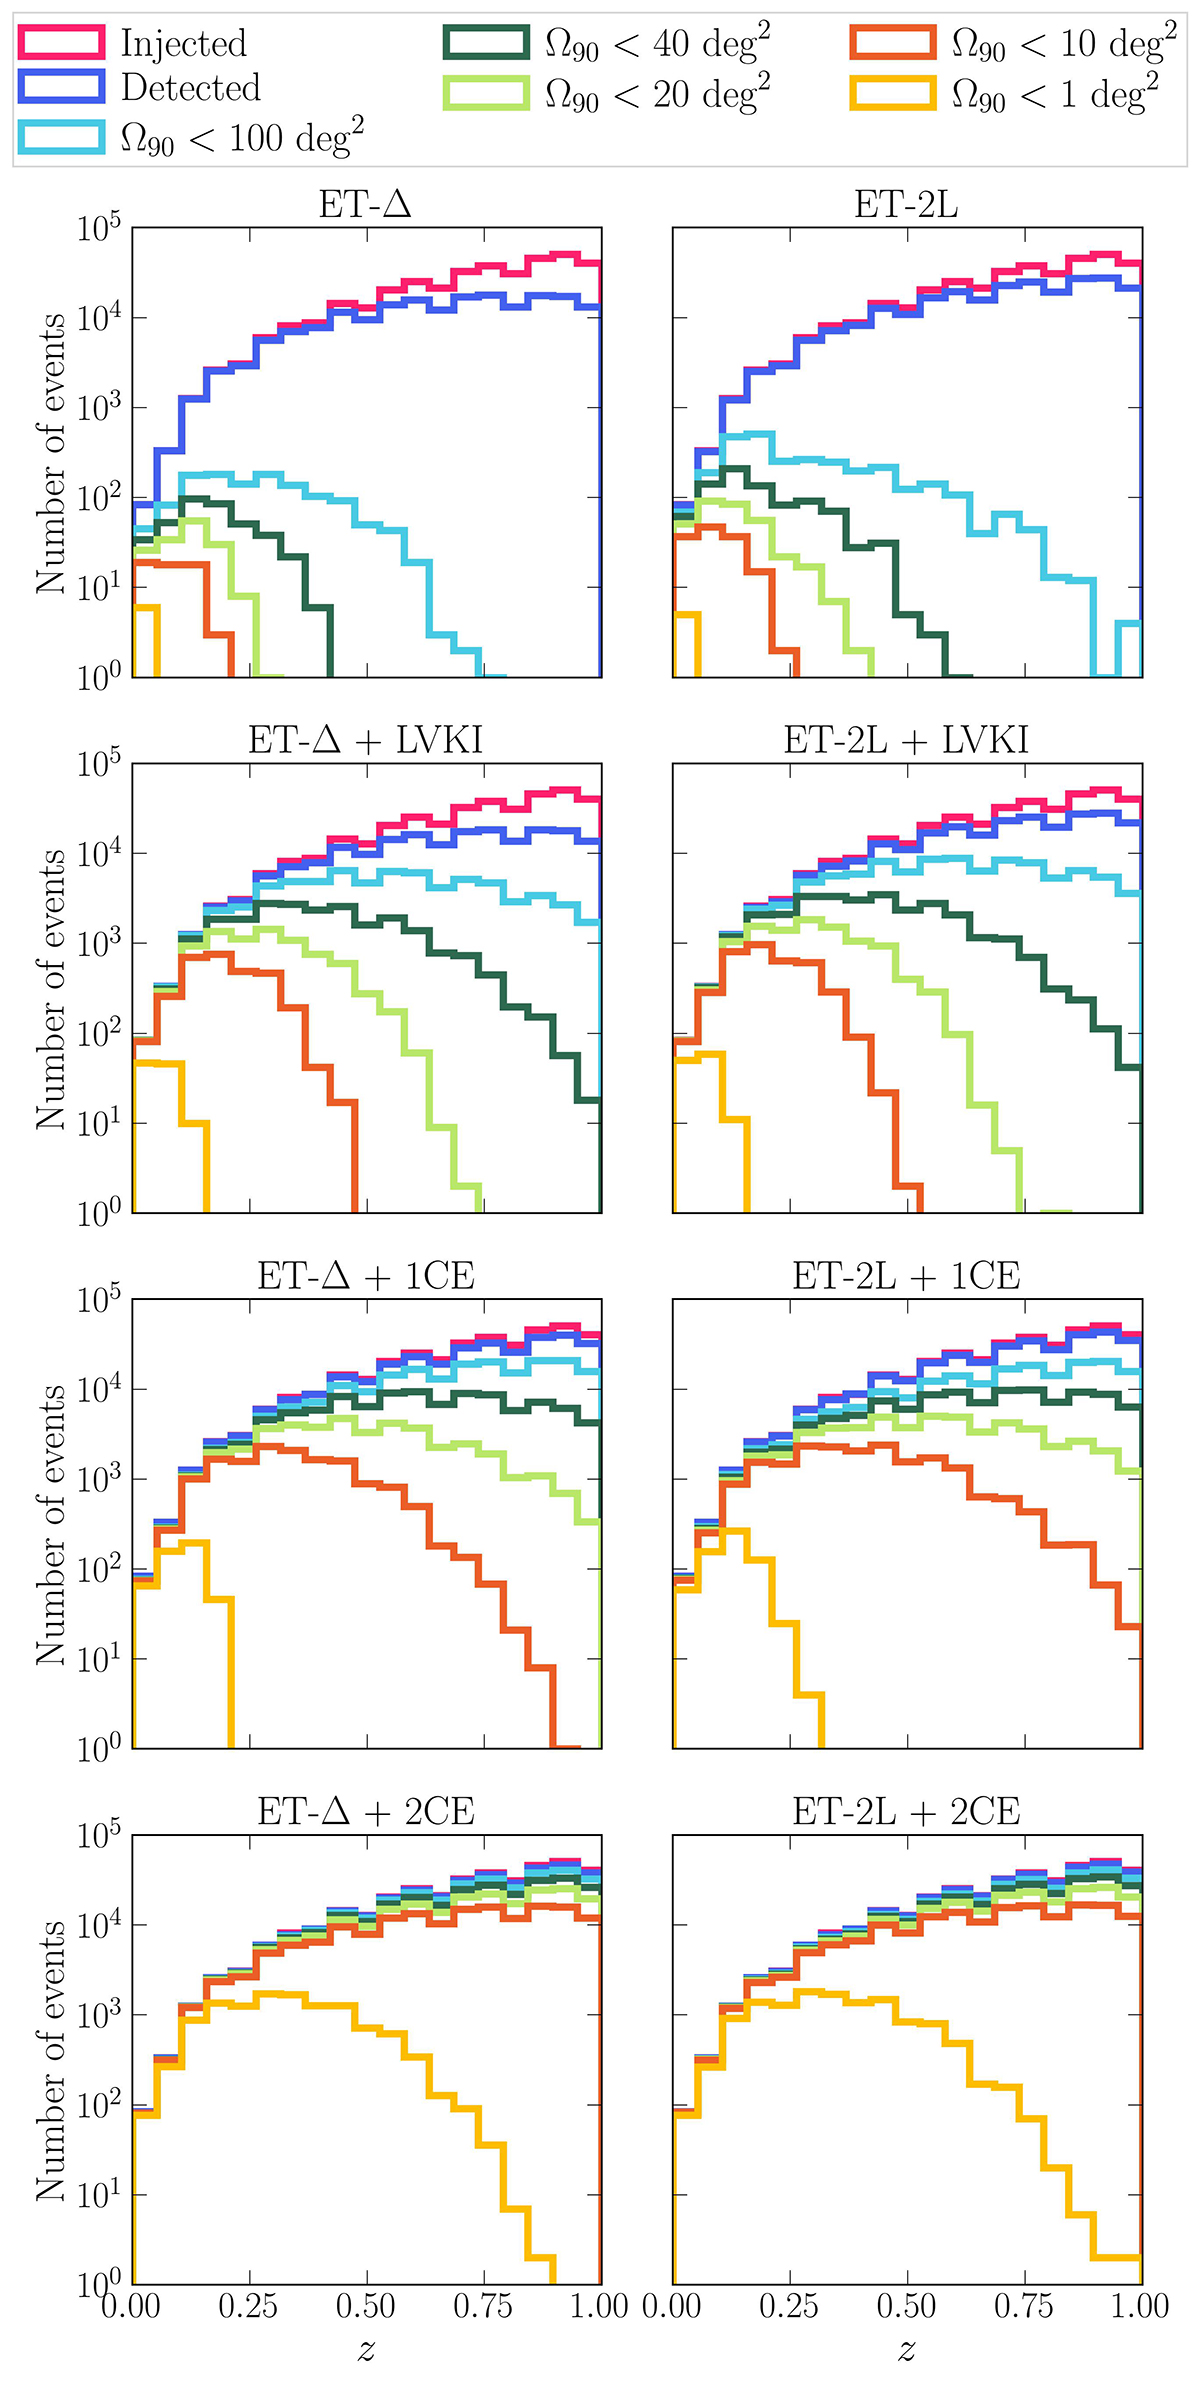
Fig. 9.
Download original image
Number of injected events and events localised better than 100 deg2, 40 deg2, 20 deg2, 10 deg2, and 1 deg2 by the different detector networks considered in this work for the fiducial population (α = 1) obtained assuming the BLh EOS and uniform NS mass distribution. The left plots show the ET-triangle and the right plots ET-2L shape. In Appendix D, we show the same plots for BLh Gaussian NS mass distribution, and APR4 uniform and Gaussian NS mass distribution.
Current usage metrics show cumulative count of Article Views (full-text article views including HTML views, PDF and ePub downloads, according to the available data) and Abstracts Views on Vision4Press platform.
Data correspond to usage on the plateform after 2015. The current usage metrics is available 48-96 hours after online publication and is updated daily on week days.
Initial download of the metrics may take a while.