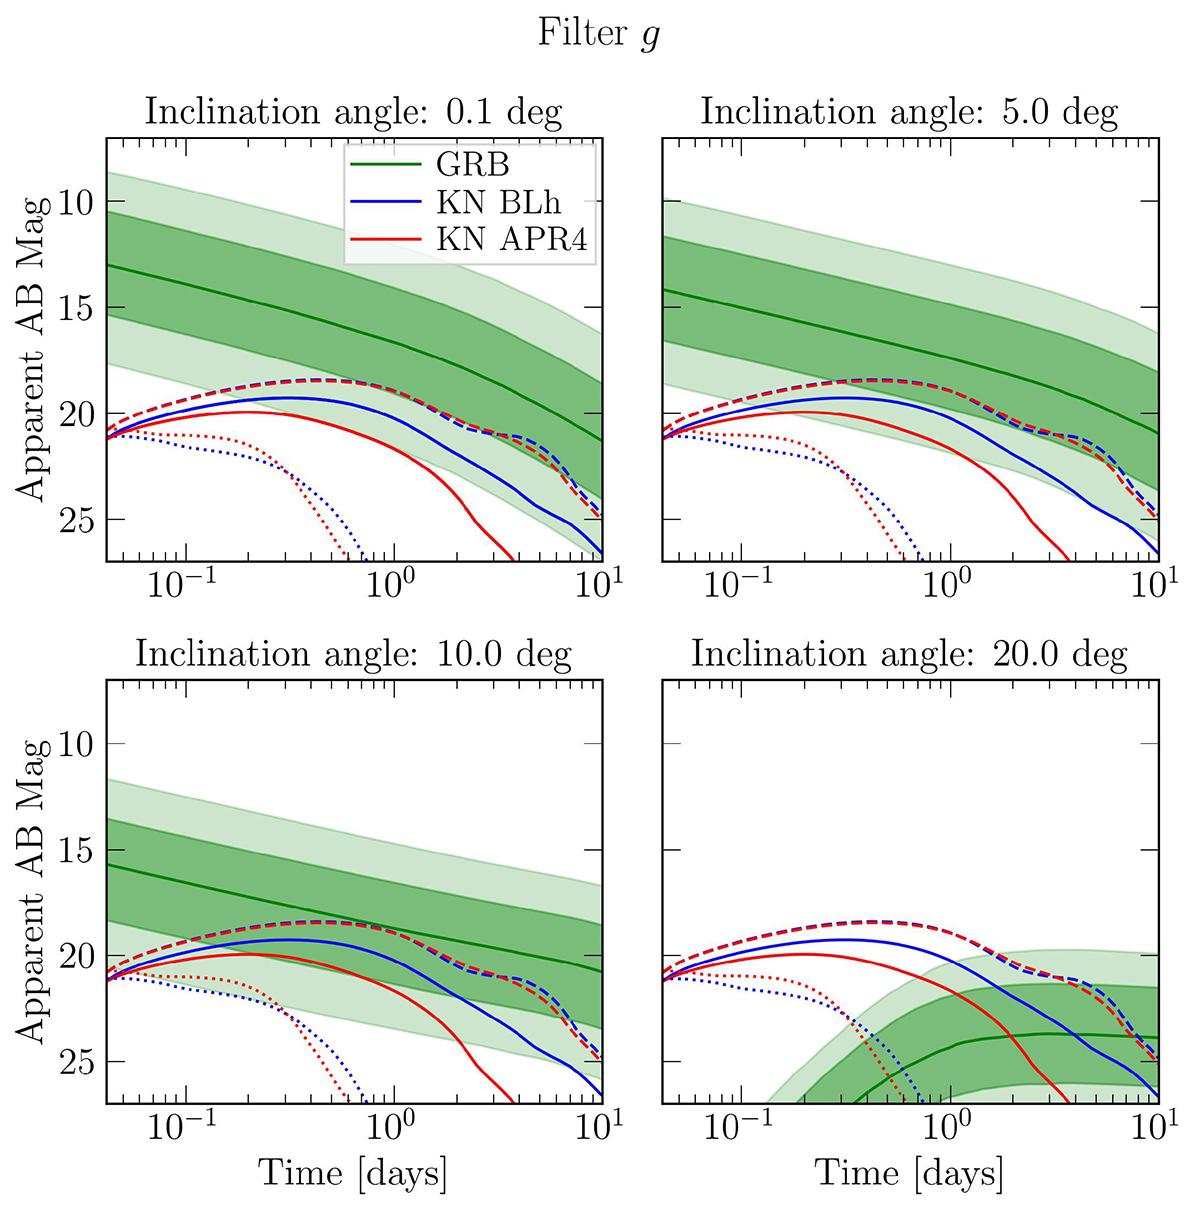
Fig. 5.
Download original image
GRB afterglow distribution (green region) compared to KNe light curves for BLh (blue lines) and APR4 (red lines) EOSs computed in the g filter of Rubin and at different inclination angles, assuming luminosity distance dL = 100 Mpc. The green line, dark green region and light green region correspond to the median, the 16–84 percentiles, and the 2.5–97.5 percentiles of the afterglow distribution, respectively. The KNe light curves correspond to three different BNS systems sampled from the BNS population with α = 1.0 and Gaussian mass distribution. Solid lines correspond to M1=M2 = 1.33 M⊙, that is the peak of the NS mass distribution; dashed lines correspond to M1 = 1.18 M⊙, M2 = 1.10 M⊙, that is the BNS producing the most massive disc; dotted lines correspond to M1=M2 = 1.57 M⊙, that is the BNS producing the lightest disc.
Current usage metrics show cumulative count of Article Views (full-text article views including HTML views, PDF and ePub downloads, according to the available data) and Abstracts Views on Vision4Press platform.
Data correspond to usage on the plateform after 2015. The current usage metrics is available 48-96 hours after online publication and is updated daily on week days.
Initial download of the metrics may take a while.