Fig. 4.
Download original image
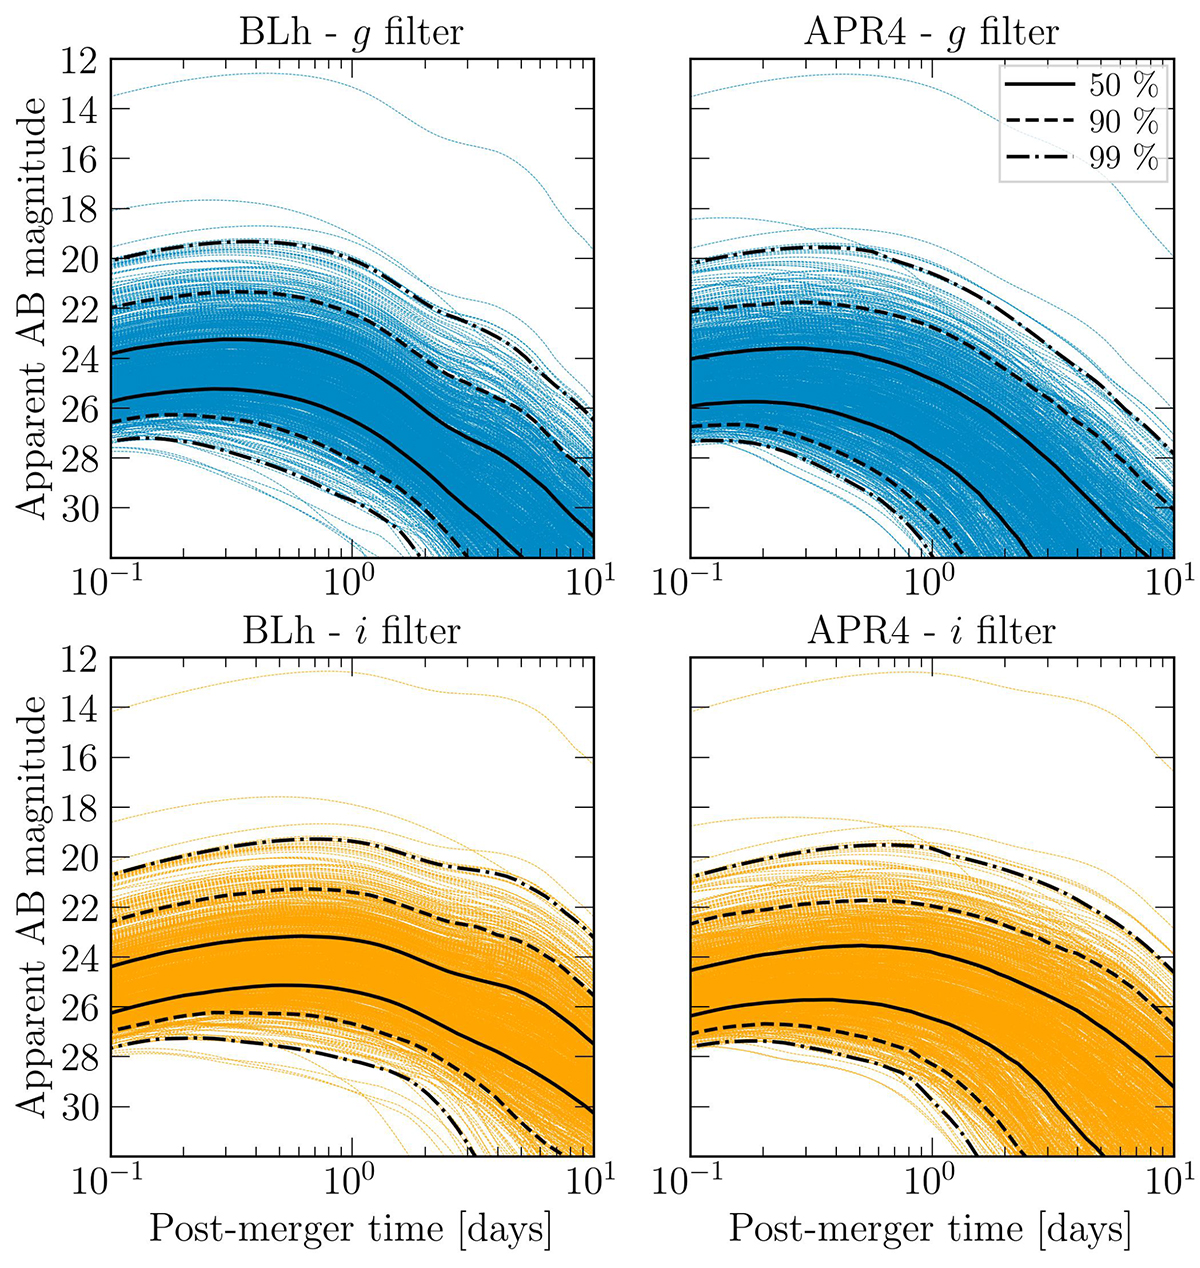
KN light curves for the g (top) and i (bottom) filters. These light curves were generated from BNS merger fiducial populations, Gaussian NS mass distribution, and the BLh (left) and APR4 (right) EOSs. The plotted light curves are associated with BNS mergers detectable by ET reference design with a sky localisation accuracy better than 100 deg2. The solid, dashed, and dash-dot black lines mark the 50%, 90%, and 99% probability distributions of the light curves.
Current usage metrics show cumulative count of Article Views (full-text article views including HTML views, PDF and ePub downloads, according to the available data) and Abstracts Views on Vision4Press platform.
Data correspond to usage on the plateform after 2015. The current usage metrics is available 48-96 hours after online publication and is updated daily on week days.
Initial download of the metrics may take a while.