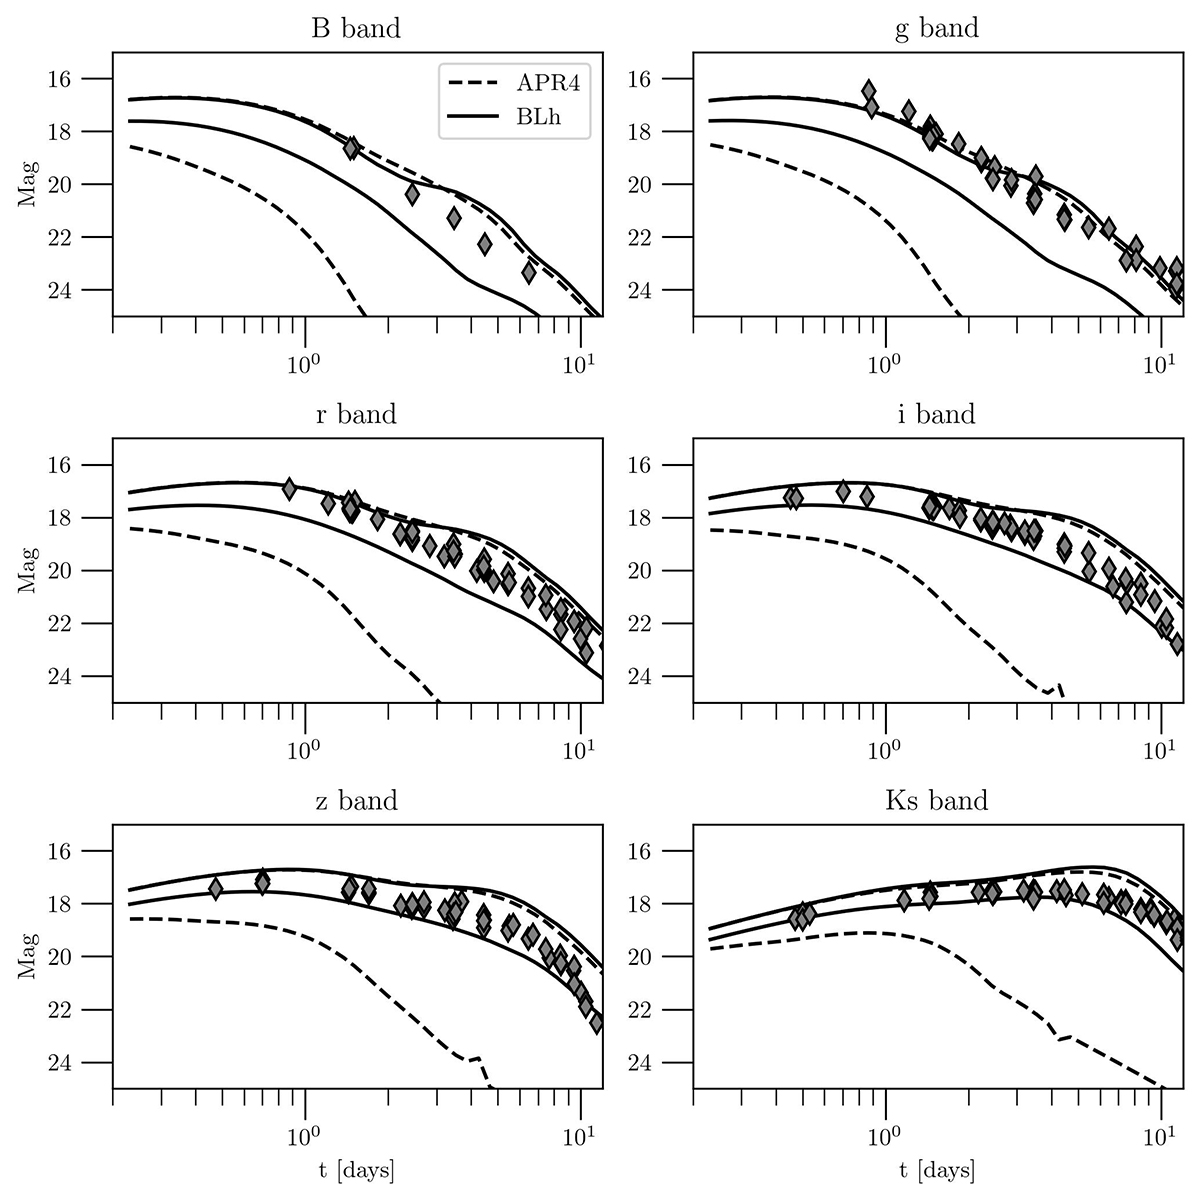
Fig. C.5.
Download original image
Comparison between AT2017gfo data (apparent AB magnitude) in the B, g, r, i, z, Ks bands (diamonds) (Villar 2017) and the KN light curves corresponding to the brightest and the faintest KN signals obtained by selecting (BNSs) with chirp mass Mchirp = 1.186±0.005 and binary mass ratio q>0.725 from the population with α = 1.0 and Gaussian mass distribution. Dashed and solid lines correspond to the case of APR4 and BLh, respectively.
Current usage metrics show cumulative count of Article Views (full-text article views including HTML views, PDF and ePub downloads, according to the available data) and Abstracts Views on Vision4Press platform.
Data correspond to usage on the plateform after 2015. The current usage metrics is available 48-96 hours after online publication and is updated daily on week days.
Initial download of the metrics may take a while.