Open Access
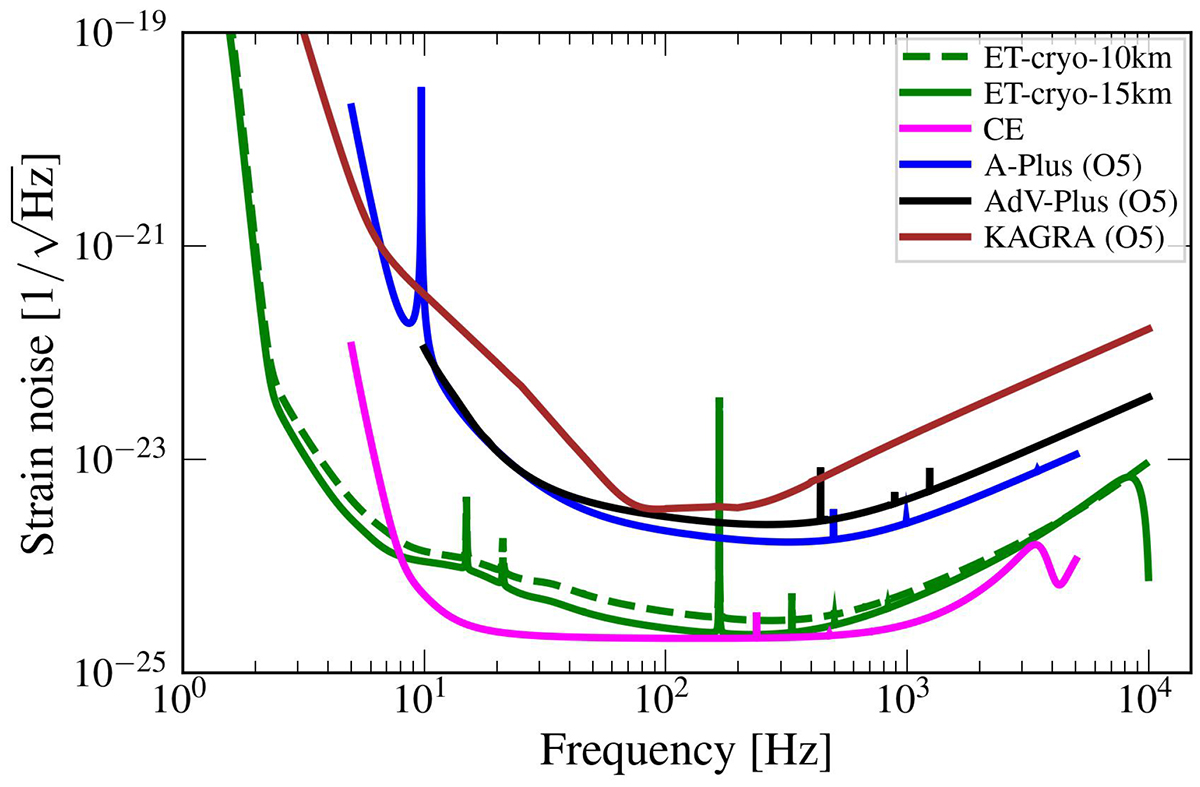
Fig. B.1.
Download original image
Sensitivity curves used in the analysis. The ET strain noise is plotted considering a single nested detector, composed of a low-frequency and a high-frequency interferometer. Our analysis takes into account that the triangular-shaped ET consists of three nested detectors, each of them with the same sensitivity curve.
Current usage metrics show cumulative count of Article Views (full-text article views including HTML views, PDF and ePub downloads, according to the available data) and Abstracts Views on Vision4Press platform.
Data correspond to usage on the plateform after 2015. The current usage metrics is available 48-96 hours after online publication and is updated daily on week days.
Initial download of the metrics may take a while.