Fig. 17.
Download original image
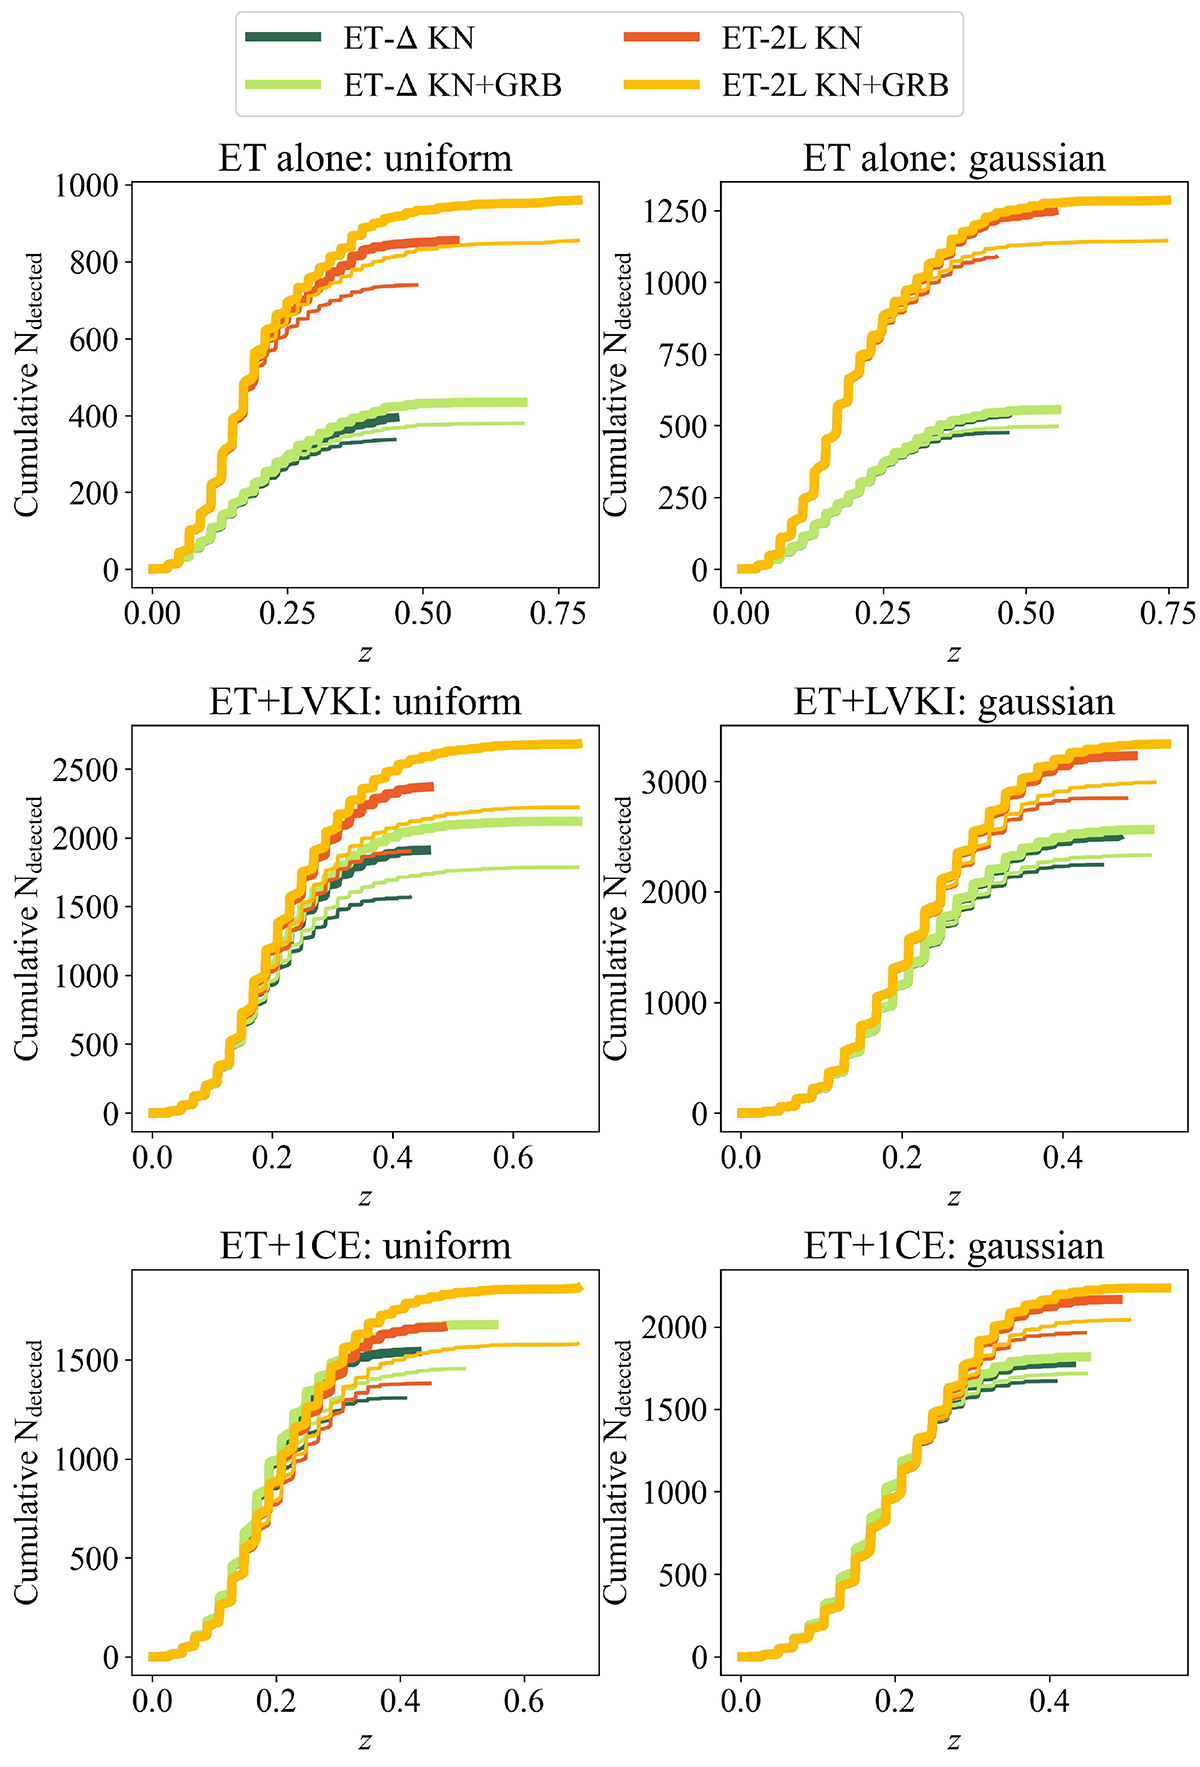
Cumulative number of KN and KN+GRB counterpart detections obtained as a function of the redshift for ET for both ET-triangle and 2L. The thick lines indicate the 1200 s exposure strategy and the thin lines the 600 s exposure. The detections were obtained following up all the events with a sky localisation smaller than 100 deg2 for ET alone (top panels), 20 deg2 for ET+LVKI (middle panels) and 5 deg2 for ET+1CE (bottom panels). The left panels show the results obtained for the uniform NS mass distribution, while the right panels show the ones obtained for the NS Gaussian distribution. All plots refer to the BLh EOS.
Current usage metrics show cumulative count of Article Views (full-text article views including HTML views, PDF and ePub downloads, according to the available data) and Abstracts Views on Vision4Press platform.
Data correspond to usage on the plateform after 2015. The current usage metrics is available 48-96 hours after online publication and is updated daily on week days.
Initial download of the metrics may take a while.