Fig. 16.
Download original image
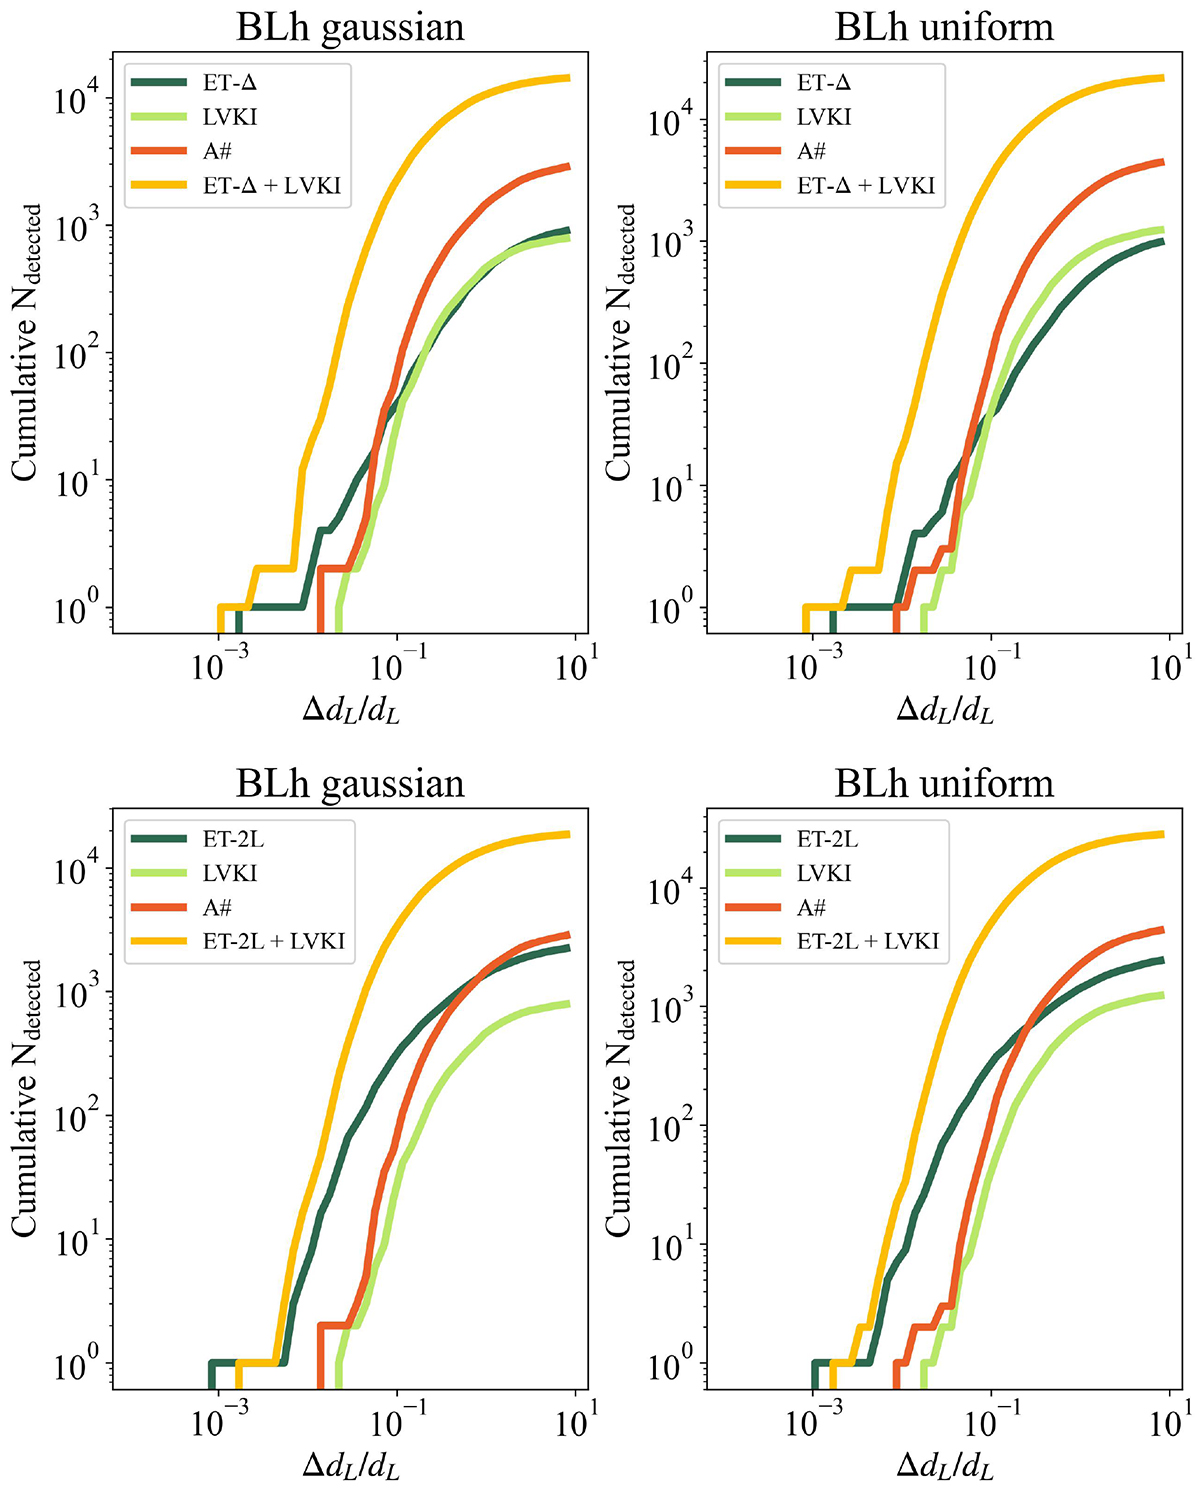
Parameter estimation capability of different GW detectors (ET alone, LVKI, 3A#, ET+LVKI) in terms of relative error in the luminosity distance (ΔdL/dL) corresponding to the GW detections of Figure 15. The top panels refer to ET-Δ, while the bottom panels to ET-2L. Each curve represents a different GW detector network, and the y-axis shows the cumulative number of GW detections with a relative uncertainty on dL smaller than the values in the x-axis. The maximum Ω90 used in the analysis is set at 100 deg2 for each GW network, except for ET+LVKI for which it is set at 40 deg2. The shown results are obtained using the fiducial population, the BLh EOS, both the uniform and Gaussian NS mass distributions, and 1ep strategy.
Current usage metrics show cumulative count of Article Views (full-text article views including HTML views, PDF and ePub downloads, according to the available data) and Abstracts Views on Vision4Press platform.
Data correspond to usage on the plateform after 2015. The current usage metrics is available 48-96 hours after online publication and is updated daily on week days.
Initial download of the metrics may take a while.