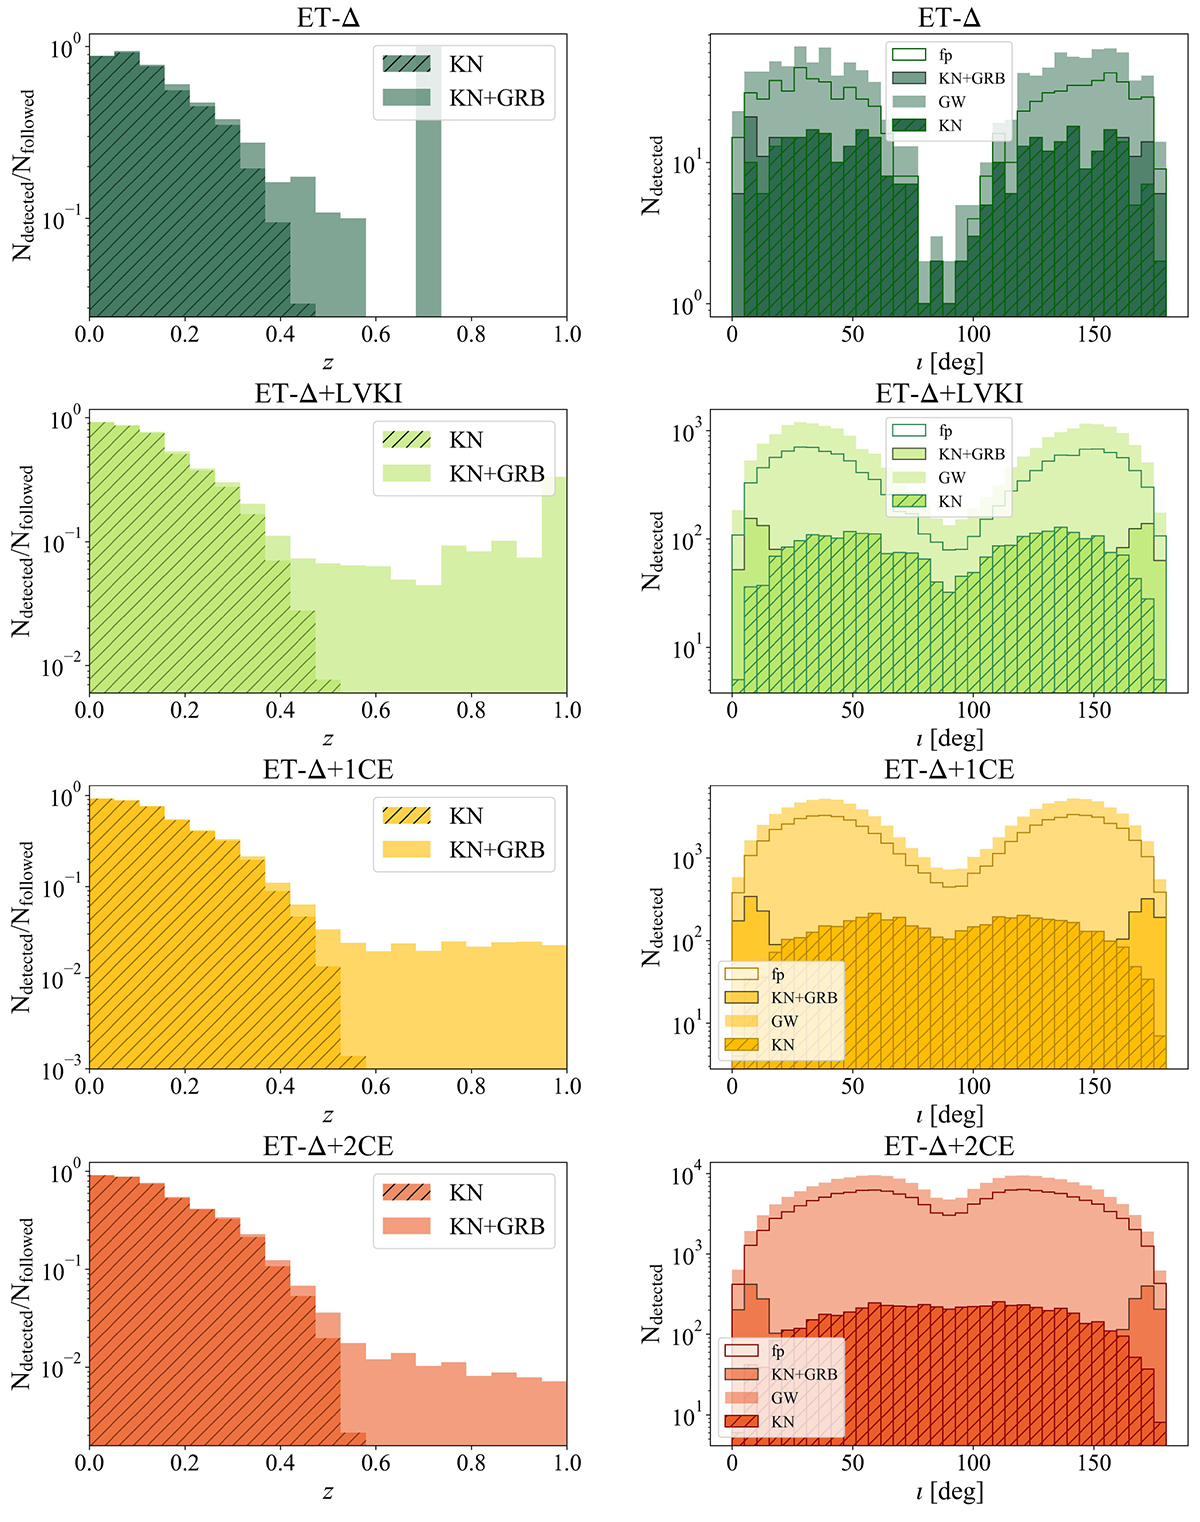
Fig. 12.
Download original image
Efficiency of joint detections and distribution of inclination angles of BNS mergers. Left panels: efficiency of joint detections as a function of redshift for ET-Δ in each network configuration for both KN (hashed) and KN+GRB (solid) histograms. Right panels: distribution of the inclination angle, ι, for each network configuration indicated in the legends of the left panels. The plots show all the detected (GW) events with a sky localisation within Ω90<100 deg2 for ET alone, Ω90<40 deg2 for ET+LVKI and ET+1CE, and Ω90<20 deg2 for ET+2CE (as used for Fig. 11), the events followed-up as within the Rubin footprint (fp), the corresponding KN detections, and the KN+GRB detections. The plots show the results obtained for the BLh EoS and the uniform NS mass distribution using the 1ep strategy.
Current usage metrics show cumulative count of Article Views (full-text article views including HTML views, PDF and ePub downloads, according to the available data) and Abstracts Views on Vision4Press platform.
Data correspond to usage on the plateform after 2015. The current usage metrics is available 48-96 hours after online publication and is updated daily on week days.
Initial download of the metrics may take a while.