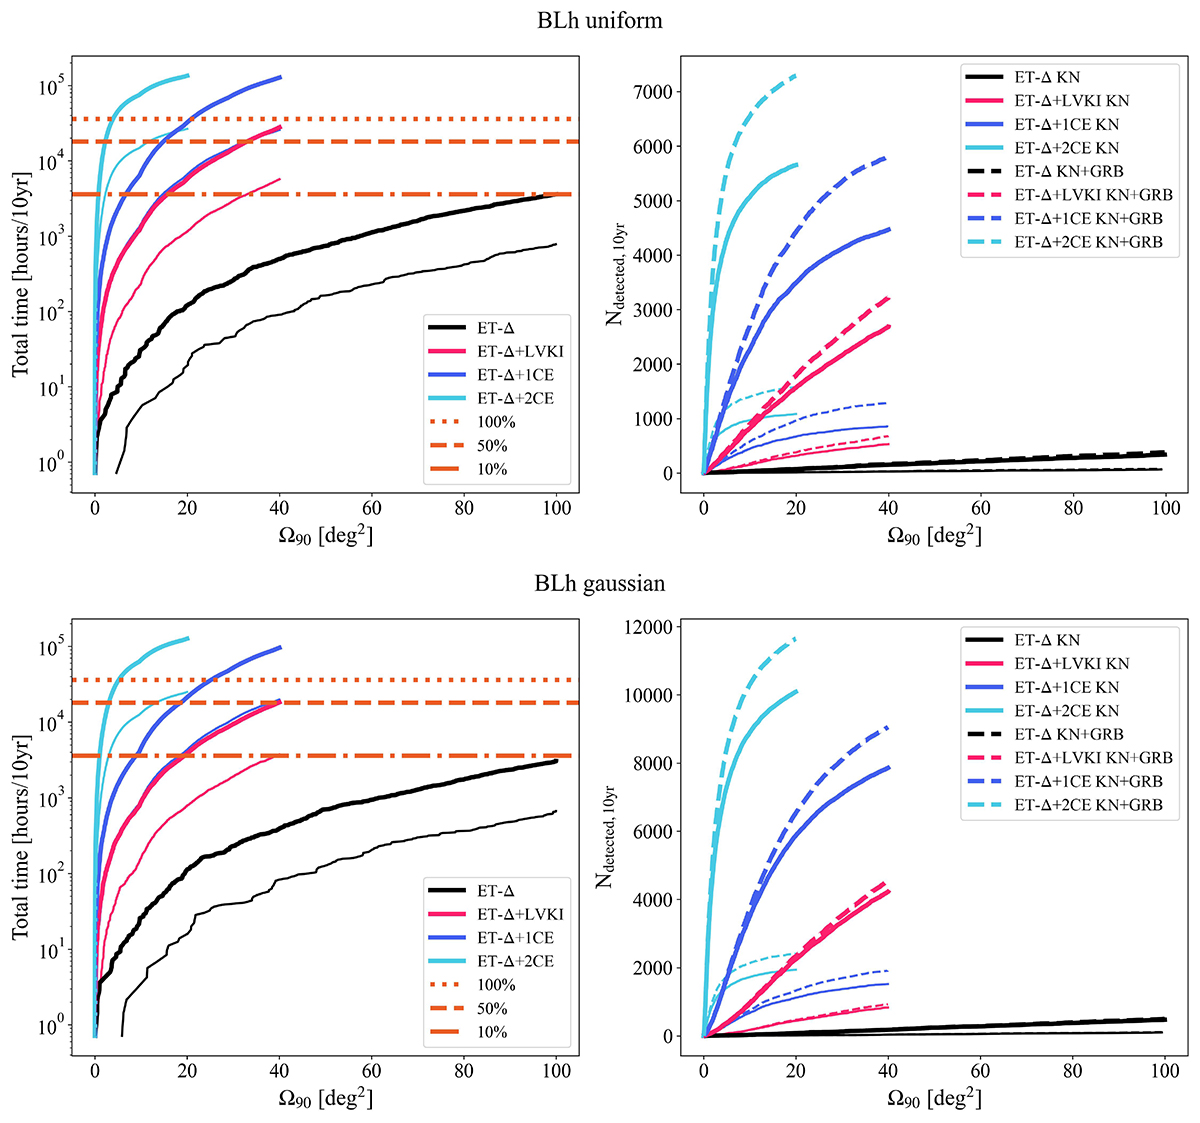
Fig. 11.
Download original image
Cumulative time required and total number of joint detections for Rubin follow up. Left panels: cumulative time necessary to follow up all the events in the Rubin footprint with a sky localisation smaller than Ω90 (indicated in the x-axis) for ET-triangle as a single observatory, and included in a network of current and future GW detectors as indicated in the legend. The horizontal dashed lines indicate the time corresponding to 10%, 50%, and 100% of Rubin's total observational time in 10 years. Right panels: the corresponding number of optical detections by Rubin. Solid lines are for the KN emission, while dashed lines are for the KN+GRB afterglow. All plots refer to the BLh EOS; the top row plots are obtained using the uniform NS mass distribution and the bottom row ones for the Gaussian NS mass distribution. Thick lines represent the fiducial population (α = 1.0) whereas the thin lines represent the pessimistic population (α = 0.5).
Current usage metrics show cumulative count of Article Views (full-text article views including HTML views, PDF and ePub downloads, according to the available data) and Abstracts Views on Vision4Press platform.
Data correspond to usage on the plateform after 2015. The current usage metrics is available 48-96 hours after online publication and is updated daily on week days.
Initial download of the metrics may take a while.