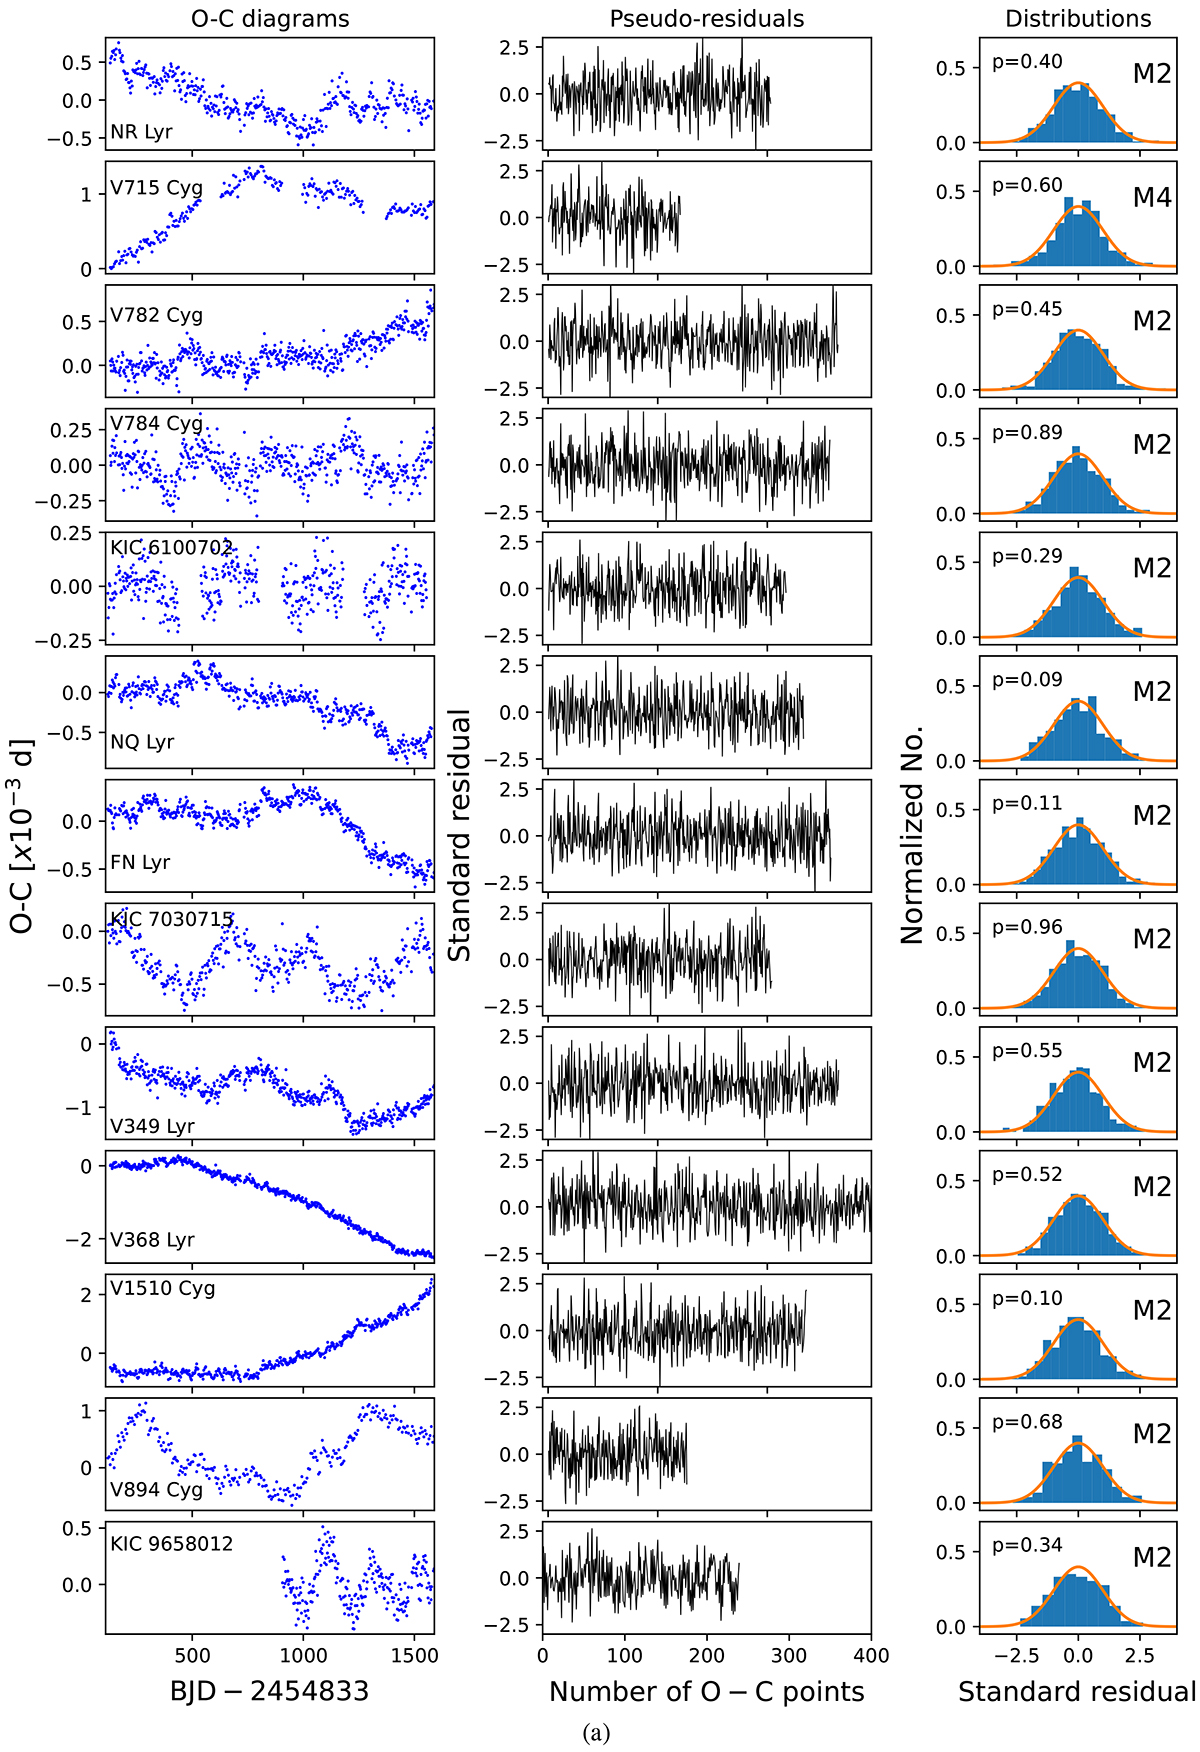
Fig. A.1.
Download original image
First column: ‘Raw’ O−C diagrams, namely, without subtracting the quadratic fit performed by Benkő et al. (2019). Note: there are very different vertical scales shown in each panel. Second column: Pseudo-residuals (see formula (9)) associated with the best statistical model. Third column: Normalised distribution of pseudo-residual values (blue histograms) compared to the standard normal distribution (orange curves). In the upper right corner of the panels, the resulting optimal model (M1-M4) is indicated. In the upper left corner, the p-value of the normality test is given.
Current usage metrics show cumulative count of Article Views (full-text article views including HTML views, PDF and ePub downloads, according to the available data) and Abstracts Views on Vision4Press platform.
Data correspond to usage on the plateform after 2015. The current usage metrics is available 48-96 hours after online publication and is updated daily on week days.
Initial download of the metrics may take a while.