Open Access
Fig. 2.
Download original image
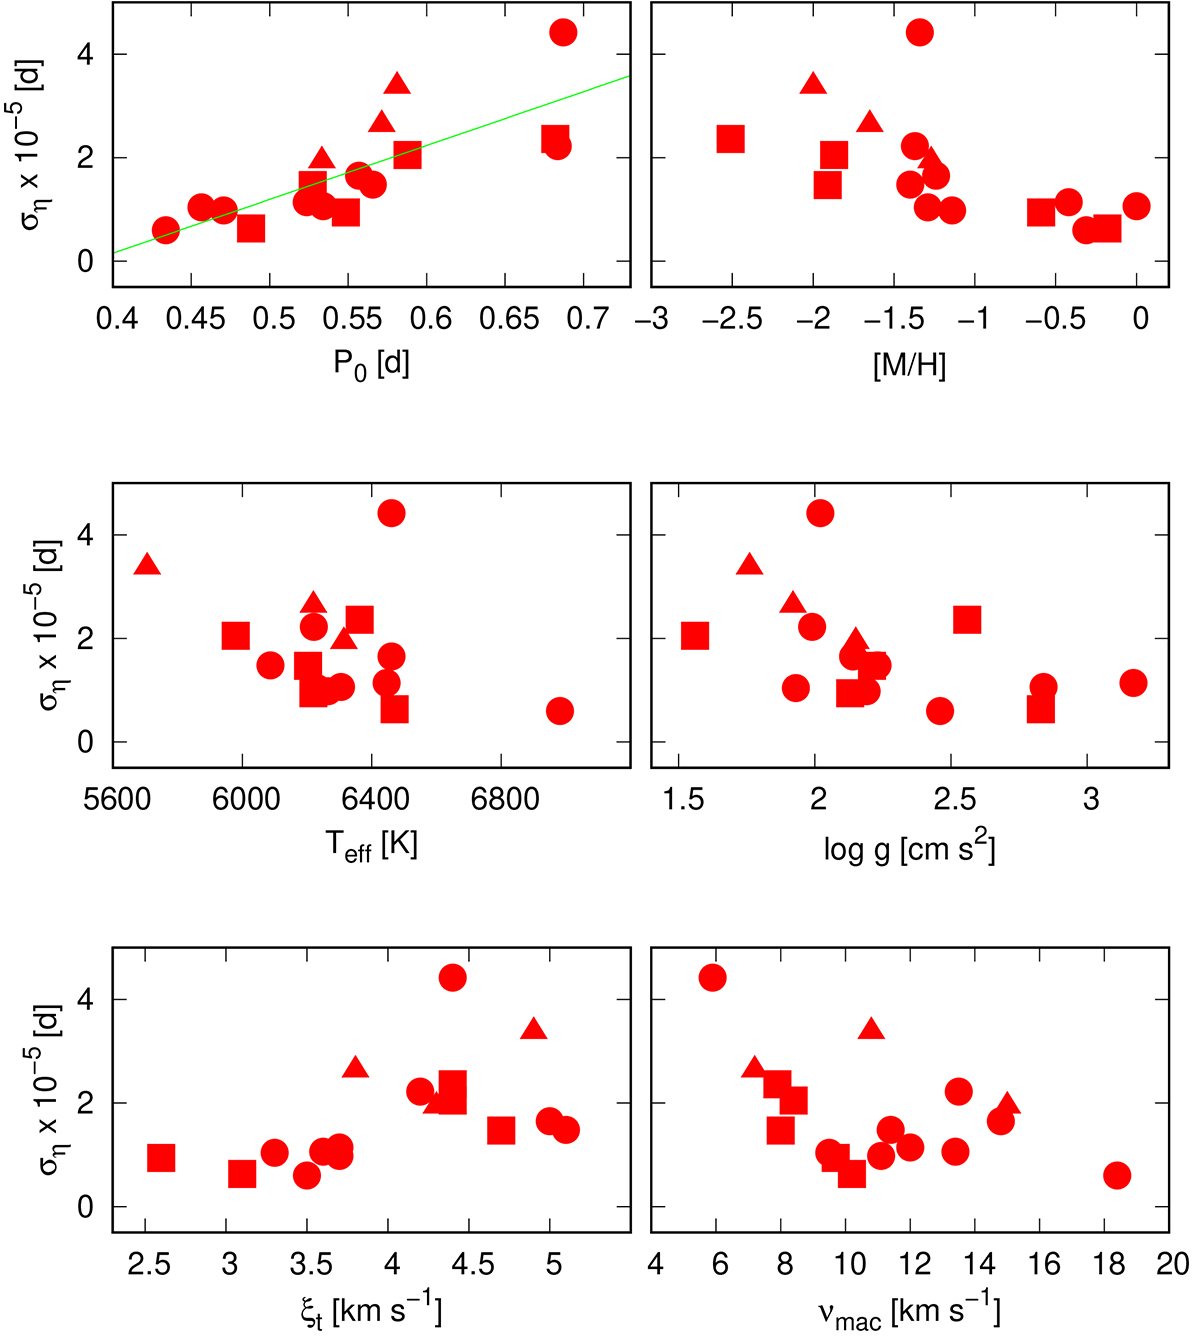
Strength of C2C variation as a function of the main period and some physical parameters for Kepler RRab stars. The stars with no additional frequencies, f1 and f2 frequencies are plotted as filled circles, rectangles and triangles, respectively. The green line shows the significant correlation between period and ση.
Current usage metrics show cumulative count of Article Views (full-text article views including HTML views, PDF and ePub downloads, according to the available data) and Abstracts Views on Vision4Press platform.
Data correspond to usage on the plateform after 2015. The current usage metrics is available 48-96 hours after online publication and is updated daily on week days.
Initial download of the metrics may take a while.