| Issue |
A&A
Volume 697, May 2025
|
|
|---|---|---|
| Article Number | A133 | |
| Number of page(s) | 14 | |
| Section | Stellar atmospheres | |
| DOI | https://doi.org/10.1051/0004-6361/202452778 | |
| Published online | 15 May 2025 | |
High-precision broadband linear polarimetry of early-type binaries
V. The binary system HD 165052 in the open cluster NGC 6530
1
Department of Physics and Astronomy,
20014
University of Turku,
Finland
2
Graduate School of Sciences, Tohoku University, Aoba-ku,
980-8578
Sendai,
Japan
3
Istituto ricerche solari Aldo e Cele Daccó (IRSOL), Faculty of Informatics, Università della Svizzera italiana,
Via Patocchi 57,
Locarno,
Switzerland
4
Euler Institute, Faculty of Informatics, Università della Svizzera italiana,
Via la Santa 1,
6962
Lugano,
Switzerland
5
Institut für Sonnenphysik (KIS),
Georges-Köhler-Allee 401A,
79110
Freiburg,
Germany
★ Corresponding author: yasir.abdulqadir@utu.fi
Received:
28
October
2024
Accepted:
28
March
2025
Aims. This is a continuation of our study of early-type binaries with high-precision broadband polarimetry. Here we present the results of our observations of the massive O+O-type binary system HD 165052 located in the very young open cluster NGC 6530. Our aim was to investigate the variations in linear polarization in this system with time and obtain an independent estimate of the orbital period from polarization data. By fitting phase-locked variations in Stokes parameters q and u, it is possible to obtain independent estimates of the orbit inclination, i, orientation, Ω, and the direction of rotation.
Methods. We employed the DiPol-2 polarimeter in combination with the remotely controlled 60 cm KVA and Tohoku T60 telescopes. Linear polarization measurements of HD 165052 were obtained in the B, V, and R passbands with an accuracy better than ~0.01%. The Lomb–Scargle method of period search was applied to the acquired polarization data to identify periodic signals. To study interstellar polarization in NGC 6530, we observed 25 cluster stars located in close proximity to the binary.
Results. Our observations reveal clear periodic variations in the Stokes parameters in all three passbands with amplitudes of ~0.1%. A period search applied to polarization data detected the strongest (and unambiguous) periodic signal at 1.47755 ± 0.005 d, which corresponds to half of the orbital period, 2.95510 ± 0.005 d. Our independent period search, performed on polarization data, supports a shorter orbital period for HD 165052 (as determined from radial velocity measurements done in the past) and rejects the longer value obtained very recently. In the observed polarization variations, the second terms of the Fourier harmonics clearly dominate, suggesting that light scattering material is symmetrically distributed with respect to the orbital plane. We conclude that the most probable polarization mechanism is electron scattering in the interacting stellar winds. To evaluate the effect of nonperiodic noise on the orbital parameters derived from the analysis of periodic variations in polarization, we ran rigorous Monte Carlo simulations. We thereby derived our best estimate of the orbital inclination, i, as 55° + 5°/−55°, and Ω as 148°(328°) + 20°/−22° averaged over the B, V, and R passbands. These values provide direct and unambiguous evidence that nonperiodic noise, if present, significantly reduced the accuracy of orbital parameters obtained from high-precision polarization data for the low-inclination systems. Using the values of the polarization variability amplitude, we estimated the mass-loss rate for the whole system to be Ṁ = 2.46 × 10⁻⁷ ± 2.47 × 10⁻⁸ M⊙ yr−1. The direction of the binary system rotation on the plane of the sky is clockwise. Our observations of HD 165052 neighbor stars reveal a complex behavior of interstellar polarization in the cluster NGC 6530.
Key words: polarization / instrumentation: polarimeters / techniques: polarimetric / binaries: close / binaries: general / pulsars: individual: HD 165052
© The Authors 2025
 Open Access article, published by EDP Sciences, under the terms of the Creative Commons Attribution License (https://creativecommons.org/licenses/by/4.0), which permits unrestricted use, distribution, and reproduction in any medium, provided the original work is properly cited.
This article is published in open access under the Subscribe to Open model. Subscribe to A&A to support open access publication.
1 Introduction
Early-type binaries are massive and luminous binary stars with early B or O spectral type companions. One of the key features of such binaries is that they often exhibit a noticeable amount of circumbinary material even if neither of the companions is filling its Roche lobe. This occurs due to the extensive stellar winds. Interaction between these winds results in the formation of a hot bow shock area of the ionized gas between and around the companions. Light scattering on such gas can give rise to the variable linear polarization. Studying such polarization provides important information on the orbital parameters of the system and distribution of the circumbinary material. We have been conducting polarimetric observations of early-type binaries using the DiPol-2 polarimeter for about a decade. In our previous papers we have presented results obtained for the early-type binaries HD 48099 (Berdyugin et al. 2016), AO Cassiopeiae (Abdul Qadir et al. 2023a), and DH Cephei (Abdul Qadir et al. 2023b). In this paper we present the results of our polarimetric study of the early-type binary system HD 165052.
HD 165052 is a double-lined spectroscopic binary that consists of an O7Vz primary star and an O7.5Vz secondary star with a mass ratio q = Ms/Mp = 0.91 ± 0.01 (Ferrero et al. 2013). The orbital period values determined in the last ~20 years range from 2.95510 d (Arias et al. 2002) to 2.95585 d Rosu et al. (2023). Due to the noticeable eccentricity of the orbit (e = 0.09) and the clear presence of the apsidal motion in HD 165052, a number of detailed spectroscopic investigations have been conducted for this system in the past (e.g., Morrison & Conti 1978; Stickland et al. 1997; Ferrero et al. 2013; Arias et al. 2002; Linder et al. (2007); Rosu et al. (2023). HD 165052 belongs to the very young Galactic open cluster NGC 6530, which has been well studied due to its interesting history of star formation (e.g., Sung et al. 2000; Damiani et al. 2006; Topasna et al. 2020).
As far as we know, no comprehensive polarization studies of HD 165052 and NGC 6530 have been undertaken in the past. Therefore, we carried out a series of precise broadband linear polarization observations of HD 165052 and measured the linear polarization of its 24 nearby stars within NGC 6530. Our main goal was to detect potential orbital phase-locked variable linear polarization in HD 165052. This allowed us to obtain independent estimates of its orbital parameters and study the distribution of circumbinary material. We emphasize that this goal can be achieved even if the exact amount of the interstellar (IS) polarization component cannot be determined.
2 Polarimetric observations
The first polarization dataset, spanning 32 nights, was obtained in 2012 with the DiPol-2 (Piirola et al. 2014) polarimeter on the 60 cm KVA (Kungliga Vetenskaps Akademientelescope) telescope at the Observatory Roque de los Muchachos (La Palma, Canary Islands). In 2015 and 2016, we gathered another sets of data that spanned over 9 nights and 4 nights subsequently with the same polarimeter on the 60 cm Tohoku T60 telescope at Haleakalā Observatory (Hawaii). Finally, a last set of data, spanning over 23 nights, was acquired with the T60 telescope in 2023. In the year 2023, 24 field stars, members of NGC 6530 cluster in the vicinity of HD 165052 were also observed. All our polarimetric observations were conducted in the B, V, and R passbands simultaneously in remote mode. For HD 165052, we usually obtained 256 images with an exposure time of 10 s per each night, which yielded 64 measurements of the Stokes q and u parameters. Corresponding observational log is given in Table A.1.
The process of data reduction involved standard calibration, including bias and dark frame subtraction. Correction for flat-field effects is also done, although this correction does not impact final results significantly. Normalized Stokes q and u parameters were derived from flux intensity ratios of orthogonally polarized stellar images Qi = Ie(i)/Io(i), obtained at orientations of half-wave plate i = 0.0°, 22.5°, 45.0°, 67.5°,..., 337.5°. More details can be found in Piirola et al. (2020) and Abdul Qadir et al. (2023a).
To determine instrumental polarization, we observed about two dozen non-polarized standard stars. The instrumental polarization for both telescopes in the B, V, and R bands ranged from 0.004% to 0.006%, determined with the accuracy of 0.0002–0.0003%. Highly polarized standard stars HD 204827 and HD 25443 were used to calibrate the polarization angle zero-point (see Table A.2 for their polarization degrees and angles). The errors of the nightly average polarization measurements for T60 are from 0.001% to 0.004% in the B and R bands and from 0.002% to 0.006% in the V band. For the data obtained with the KVA, the errors are somewhat larger, and are in the range from 0.006% to 0.015%.
3 Data analysis
3.1 Period search
To search for periodic signals in our polarimetric data, we employed the Lomb–Scargle algorithm (Lomb 1976; Scargle 1982). The benefit of using Lomb–Scargle algorithm is that it uses the least squares method to fit a sinusoidal on unevenly sampled data, which is often the case with astronomical data. To execute the Lomb–Scargle algorithm with PYTHON code, we used a package from astropy.timeseries 1 (Price-Whelan et al. 2018).
The variations in Stokes parameters of polarization arising from the scattered light in the binary system with (near) circular orbit typically show two maxima and minima per orbital period separated by 0.5 in the orbital phase (Brown et al. 1978). Therefore, the Lomb–Scargle algorithm applied to binary polarization data is expected to detect half of the orbital period. We have plotted Lomb–Scargle periodograms for both Stokes q and u in B, V, and R passbands in Fig. 1.
As expected, Lomb–Scargle algorithm has detected half of the orbital period, Porb/2, with a well-constrained error of σorb/2. While the full orbital period (Porb) is equal to 2 ×Porb/2, the errors on Porb should remain equivalent to that of Porb/2 (i.e., σorb = σorb/2). For Stokes q, we find the best orbital periods to be Porb = 2.95510 ± 0.006 d, 2.95512 ± 0.007 d, and 2.95514 ± 0.008 d in the B, V, and R passbands, respectively. Likewise, for Stokes u, we find the best periods to be Porb = 2.95508 ± 0.006 d, 2.95510 ± 0.007 d, and 2.95508 ± 0.008 d. Thus, the derived average value over Stokes q and u and across all passbands is Porb = 2.95510 ± 0.005 d. The errors on the periods were calculated using corresponding power values and measurement uncertainties of the frequencies related to orbital period peaks given in Table 1. These frequency errors were then converted to days using the relationship ΔP = Δf/f2.
Moreover, we do notice the presence of a strong alias peak at ~3.1 d (frequency ~0.32 d−1) in all periodograms. An alias peak related to a real period can appear when the frequency of that period is not less than half of the sampling frequency, that is, the Nyquist frequency (fny). In such a situation, two waves are produced that differ by 1/fny. The (half) orbital period for HD 165052, ~1.47755 d is at frequency of ~0.68 d−1, which is more than half of our sampling frequency. Therefore, alias peaks can be expected at around 1/(1 − 1/1.47755) = 3.094 d or at frequency close to ~0.323 d−1. As one can see, the alias peaks that are close to that frequency are indeed present in our periodograms (cf. Shannon 1949; VanderPlas 2018). It is not uncommon to observe such alias peaks in Lomb–Scargle periodograms of astronomical data (e.g., Kosenkov & Veledina 2018; Abdul Qadir et al. 2023a,b).
Furthermore, we calculated false alarm probability (FAP) for the (half) orbital period of HD 165052 and its alias peaks using the bootstrap method (Suveges 2012). FAP values of both real and alias peaks in B, V, and R passbands for both Stokes q, and u are given in Table 1. The FAP values for both orbital peaks and alias peaks are very low, because the algorithm cannot distinguish between them. The value of true orbital period derived from our polarization data is very close to the values of 2.95510 d derived by Arias et al. (2002) and 2.95515 d derived by Linder et al. (2007). The longer value of orbital period 2.95585 d, obtained recently by Rosu et al. (2023), cannot be used to provide an adequate fit to observed variability of our polarization data. Thus, our independent period search, performed on polarization data, provides support for the previously measured shorter value of the orbital period in HD 165052. We did not detect the presence of any other (real) periodic signal in polarimetric data except for the orbital.
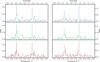 |
Fig. 1 Lomb–Scargle periodograms for Stokes q (left column) and u (right column) for HD 165052 obtained in the B, V, and R passbands (top, middle, and bottom panels, respectively). |
FAPs for the real and alias periods obtained for HD 165052 from the period search.
3.2 Interstellar polarization
HD 165052, being a rather distant binary system with a parallax of 0.7893 ± 0.0297 mas (Gaia Collaboration 2021), is expected to exhibit IS polarization component due to the presence of IS dust along the line of sight. In addition, one can expect a significant contribution to the IS polarization from the dust that is present in the young stellar cluster NGC 6530. We attempted to quantify the IS component of polarization in HD 165052 by conducting polarization observations of 24 field stars located in the vicinity of HD 165052. Results of these observations are presented in Table A.3. For each star, we give its Gaia DR3 identifier (Gaia Collaboration 2021), coordinates, parallax, polarization degree, polarization angle, and the total number of polarization measurements in the three passbands.
Figure 2 illustrates the polarization map of NGC 6530, showing a significant scatter in both polarization degrees (ranging from 0.07% to 4.15%) and polarization angles (ranging from 2° to 176°) among the observed field stars, all of which have parallaxes confined within approximately 0.3 mas. This variation in polarization properties among the cluster stars, including those closest to HD 165052, indicates that the IS polarization in NGC 6530 is strongly not uniform. Consequently, polarization data for the observed field stars cannot help us accurately determine the IS polarization component for HD 165052 itself.
The presence of significant scatter in the polarization properties of stars within the NGC 6530 suggests that the region is dynamically complex, with varying distribution of IS dust and directions of IS magnetic field. This behavior is typical for a young open clusters, where stars are still forming and interacting with their surroundings. As a result, one can expect rather complex and strongly not uniform distribution of dust on the different lines of sight within the cluster. For stars 7, 20, 21, and 22, the minimum degree of polarization is in the V passband, which is not typical for the IS polarization produced by homogeneous diffuse IS dust. We suggest that in addition to variations in dust particles orientation and density, the variations in particles size and composition may also occur in the NGC 6530. Furthermore, we cannot rule out that some of the field stars are intrinsically polarized. The most suspicious is the star 23 that shows sharp increase in the polarization toward near infrared, for example from nearly zero value in the B band to more than 1.0% in the R band.
Although we were not able to estimate the value of IS polarization component for the HD 165052, we hope that our polarimetric observations of field stars provide insights into the structure and properties of the IS medium in NGC 6530. The polarization data collected from field stars near HD 165052 can be used in future studies for examinations and modeling of the dynamic interaction between the IS dust, magnetic fields, and stellar community in the NGC 6530.
Best-fit Fourier coefficients for Stokes q and u.
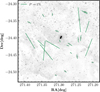 |
Fig. 2 IS polarization map in the vicinity of HD 165052. Measurements made in the V passband are presented. The binary is in the center of the field, and its average value of polarization is shown with the thicker black line. The length of the bars corresponds to the degree of linear polarization, P, and the direction corresponds to the polarization angle (measured from the north to the east). |
3.3 Periodic polarization variability and orbital parameters
We used standard analytical method based on two-harmonics Fourier fit, commonly known as the BME (Bown McLean Emslie) approach (Brown et al. 1978), to fit the phase-folded curves of the Stokes q and u parameters. This method assumes a circular orbit with corotating light scattering envelope and the fit includes zeroth, first, and second harmonics terms:
![$\[\begin{aligned}& q=q_0+q_1 ~\cos~ \lambda+q_2 ~\sin~ \lambda+q_3 ~\cos~ 2 \lambda+q_4 ~\sin~ 2 \lambda, \\& u=u_0+u_1 ~\cos~ \lambda+q_2 ~\sin~ \lambda+q_3 ~\cos~ 2 \lambda+q_4 ~\sin~ 2 \lambda,\end{aligned}\]$](/articles/aa/full_html/2025/05/aa52778-24/aa52778-24-eq2.png) (1)
(1)
where λ = 2πϕ, and ϕ represents the phase of the orbital period. The polarimetric data of Stokes q and u were phase-folded using the orbital period Porb [d] = 2.95510 and T0 [HJD] = 2449871.75 from Arias et al. (2002). This was an obvious choice, because the value of Porb obtained by Arias et al. (2002) is very close to that derived by us. Folding polarization data with the new value Porb = 2.95585 d obtained by (Rosu et al. 2023) revealed that it fails to represent adequately periodic variability of our polarization dataset.
Bayesian inference method was employed to fit the model to the data points (Hogg & Foreman-Mackey 2018). Using this method on Stokes q and u data for the B, V, and R passbands, we determined the optimal Fourier coefficients. Subsequently, we performed curve fitting of the observed polarization data, as shown in Fig. 3. The fit reveals an amplitude of variability of ~0.10%, accompanied by some nonperiodic scatter. We used the curve_fit function of the scipy.optimize2 library in PYTHON to determine values of Fourier coefficients that were used as initial guesses (priors) for our Bayesian interface, which enhanced the precision; the derived values are given in Table 2.
The orbital inclination i and orbit’s orientation in the sky, represented by the longitude of the ascending node Ω can be derived from the first (q1,2, u1,2) and second (q3,4, u3,4) harmonic terms of the Fourier series. Complete set of equations for computing orbital and other parameters are presented by Drissen et al. (1986). For additional details, please refer to Appendix B. However, in cases where the orbit is circular or nearly circular, and the distribution of scattering material is symmetric with respect to the orbital plane, the influence of the first harmonic terms becomes negligible. As is seen from Table 2, this a clear case for HD 165052. Small orbit eccentricity has very little to no effect on the fits, which are dominated by second harmonics. Thus, we used only the second harmonic terms to derive orbital parameters from the Fourier coefficients obtained for each passband.
The parameters Aq and Au are the amplitude ratios between the second and first harmonics of Stokes q and u, respectively. These parameters are quantifying the degree of a symmetry and concentration of scattering material around the orbital plane for a circular orbit. Expressions for computing these parameters are given in Appendix B.
By applying Eqs. (B.1)–(B.5), we computed the values of i, Ω, Aq, and Au for the B, V, and R passbands. Results are shown in Table 3. The large values of Aq and Au for all passbands indicate high degree of symmetry and/or concentration of light scattering material toward orbital plane in HD 165052.
3.4 Confidence intervals for the orbital parameters
As is evident from Fig. 3, there is a noticeable nonperiodic scatter around the fitting curves in all passbands. Moreover, because HD 165052 is a non-eclipsing system, the true inclination should be small. Thus, we should expect pronounced bias, asymmetric confidence intervals for the derived inclination i, and broad confidence intervals for Ω.
To determine the bias and corresponding confidence intervals for i and Ω, we used a “figure of merit” parameter, γ, introduced and defined by Wolinski & Dolan (1994) as
![$\[\gamma=\left(\frac{A}{\sigma_{\mathrm{p}}}\right)^2 \frac{N}{2},\]$](/articles/aa/full_html/2025/05/aa52778-24/aa52778-24-eq3.png) (2)
(2)
where A is the periodic fraction of the amplitude of polarization variability measured from the best fit and is defined as
![$\[A=\frac{\left|q_{\max }-q_{\min }\right|+\left|u_{\max }-u_{\min }\right|}{4},\]$](/articles/aa/full_html/2025/05/aa52778-24/aa52778-24-eq4.png) (3)
(3)
where σp is a standard deviation that is determined from the scatter of the observed Stokes parameters around the best-fit curves, N is the number of observations, and qmax, qmin, umax, umin are maximum and minimum values of the fitted Stokes parameters q and u. With our values of σp = 0.013, 0.011, and 0.010, we derived the corresponding values of γ = 316, 265, and 222 for the B, V, and R passbands, respectively.
Due to the unavoidable presence of noise in real polarimetric data, the inclination angle i derived from Fourier fits is consistently biased toward higher values (Aspin et al. 1981; Simmons et al. 1982; Wolinski & Dolan 1994). This bias is particularly pronounced for lower true values of i, making it increasingly challenging to constrain smaller inclinations. Real nonperiodic fluctuations present in polarization variability will also introduce a similar bias, as noted by Manset & Bastien (2000).
A critical limitation arises when the true inclination is low (i < 45°), especially for low-eccentricity orbits, as demonstrated by Manset & Bastien (2000). In such cases, the BME method cannot reliably recover the lower inclination values, resulting in systematically overestimated inclinations. Importantly, this bias also skews the confidence intervals for i, leading to asymmetric 1σ and 2σ intervals. The lower boundary of these intervals extends disproportionately toward smaller i, often reaching i = 0° for systems with low inclinations. For non-eclipsing systems such as HD 165052, this means that polarimetric data can provide only an upper limit for the true inclination, effectively excluding the possibility of constraining smaller values.
Moreover, as the true inclination decreases, the confidence intervals for the position angle of the ascending node (Ω) expand significantly (Wolinski & Dolan 1994). This systematic bias and its impact highlight the inherent difficulty in deducing orbital parameters for low inclination orbits from polarimetric data using Fourier fits.
Using our values of γ and N, the number of data points with their corresponding orbital phases and measurement errors, we conducted our own Monte Carlo simulations to determine the 1σ and 2σ confidence intervals for i and Ω (see Fig. 4). This methodology was adapted from Wolinski & Dolan (1994), but instead of relying solely on simulated data as done by Wolinski & Dolan (1994) and Manset & Bastien (2000), we incorporated the actual errors and phase sampling from our dataset. This approach ensures that our results are directly tied to the specific characteristics of our observations, rather than generalized assumptions about noise or measurement uncertainties.
In our simulations, we modeled Stokes parameters for values of i ranging from 180° to 90° with a decreasing step of 5°, using the standard Brown et al. (1978) model (Eq. (1)). This inclination range is fully equivalent to the “normal” range of 0°–90° and reflects the fact that the orbital rotation in the HD 165052 binary system is clockwise. Gaussian noise was then simulated in the Stokes parameters q and u by adding fluctuations with variance σ2 = 0.5NA2/γ. The Fourier model (Eq. (1)) was subsequently fit to the simulated data using the Bayesian approach identical to the one used for deriving the Fourier coefficients listed in Table 2.
From the simulated Fourier coefficients, we derived i′ using Eq. (B.1). Similarly, for confidence intervals of Ω, we determined Ω′ − Ω, where Ω′ was deduced using Eq. (B.2), with the input value Ω = 0 chosen for simplicity. For each input value of i, we repeated the simulations to obtain 100 values of i′ and Ω′ − Ω. This iterative approach allowed us to robustly quantify the confidence intervals and biases associated with our data, providing realistic constraints on the orbital parameters derived from our polarimetric measurements.
Our confidence intervals, shown in Fig. 4, are noticeably narrower than those presented by Wolinski & Dolan (1994) for similar values of γ. This difference is primarily due to the larger number of observations in our dataset (N= 68) compared to the N = 23 used by Wolinski & Dolan (1994). A larger N provides better phase coverage, resulting in narrower confidence intervals. While γ quantifies the precision of the Fourier fit, the density of phase sampling also plays a critical role in determining the width of the confidence intervals. Consequently, increasing N enhances phase sampling density, reducing the confidence interval width even for smaller values of γ. The slight asymmetry observed in our confidence intervals can be attributed to the uneven phase sampling inherent in real observations, unlike the evenly distributed phase coverage employed by Wolinski & Dolan (1994).
Our derived inclinations for all passbands (see Table 3) are close to the critical value of i shown in Fig. 4. Beyond this threshold, the lower limit of the 1σ confidence interval extends to i = 180° (or i = 0°; see Wolinski & Dolan 1994). This indicates that our polarization data analysis only allows us to establish an upper limit of i ≃ 55° for the orbital inclination of HD 165052.
To determine the confidence intervals for Ω, we set the true inclination angle to i = 22.7°, as determined by Rosu et al. (2023). This estimate, based on spectroscopic analysis and atmospheric modeling, is certainly more realistic than that derived from polarimetric data. O-type stars typically have masses exceeding 20 M⊙. The values of M sin3 i derived from spectroscopy by Rosu et al. (2023) and others, ranging from 1.24 M⊙ to 1.37 M⊙, imply that inclinations greater than 23.1° would result in masses below the 20 M⊙ threshold. The confidence intervals for Ω, derived using this inclination, are presented in Table 3. Despite large uncertainties, the values of Ω across different wavelengths are consistent, yielding an average orbital orientation angle on the plane of the sky of approximately 145° (~325°). We note that any Ω determined from polarization data inherently carries a ±180° ambiguity, as reflected in Table 3.
Figure 5 illustrates the ellipses of the second harmonics on the (q, u) plane for the B, V, and R passbands. The degree of eccentricity of these ellipses is directly related to the orbital inclination i, while the orientation of their major axes with respect to the q-axis corresponds to the orbital orientation Ω on the sky plane. The direction of traversal along the ellipses indicates the direction of orbital motion on the celestial plane. Given the derived inclination range of 90° ≤ i ≤ 180°, the binary system’s rotation on the plane of the sky is clockwise.
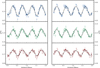 |
Fig. 3 Variability in the observed Stokes parameters q and u for HD 165052 in the B, V, and R passbands (top, middle, and bottom panels, respectively), phase-folded with the orbital period, 2.95510 d. Fourier fit curves (see Sect. 3.3) are shown with solid lines, and the best-fit Fourier coefficients are given in Table 2. The lengths of the bars correspond to ±σ errors. |
Orbital parameters for HD 165052 derived from the polarization measurements in the B, V, and R passbands.
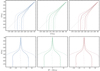 |
Fig. 4 Confidence intervals (solid lines for ±1σ and dotted lines for ±2σ) of i (upper panels) and Ω (lower panels) for γ values of 316, 265, and 222 for the B, V, and R passbands (left, middle, and right panels, respectively). The dotted lines in upper panels illustrate critical values of i. Note that the inclination range of 180°–90° shown in the plots is fully equivalent to 0°–90°. If the orbital rotation as seen on the plane of the sky is clockwise, the BME method yields inclination values between 90° and 180°. |
Best-fit Fourier coefficients for Stokes q and u for data obtained in 2012 (upper panel) and 2023 (lower panel).
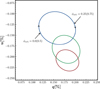 |
Fig. 5 Variability in the observed polarization for HD 165052 plotted on the Stokes (q, u) plane, represented by the ellipses of second harmonics of the Fourier fit. Blue, green, and red represent B, V, and R passbands, respectively. The clockwise direction and phases of the orbital period are shown for the B band ellipse. The angle between the major axis and the q-axis gives the orientation, Ω. |
Orbital parameter Ω for HD 165052 derived for the B, V, and R passbands for data obtained in 2012 (upper panel) and 2023 (lower panel).
3.5 Effect of the apsidal motion
HD 165052 has been known to exhibit apsidal precession (Arias et al. 2002; Ferrero et al. 2013; Rosu et al. 2023) that can be utilized for confirming the predictions of general relativity theory, as the system’s high mass and proximity make relativistic effects more pronounced. Ferrero et al. (2013) determined the apsidal motion rate of the system to be 12.1 ± 0.3° yr−1 and recently Rosu et al. (2023) derived the value of 11.3 + 0.64/−0.49° yr−1.
We benefit from our extensive polarimetric observational history of HD 165052, spanning nearly 11 years. Our dataset comprises 33 data points acquired from the KVA telescope in 2012 and an additional 23 data points collected from the T60 telescope in 2023 (Table A.1). To investigate possible effect of apsidal motion through polarimetry, we conducted separate Fourier fits on these two datasets. Best fits are shown in Fig. 6 and the corresponding Fourier coefficients are presented in Table 4. As is seen from Table 4, the effect of apsidal motion on the polarization variability, if present, appears to be very subtle. Only for Stokes u in the B-band the difference in Fourier term u4 between two datasets is larger than 3σ. The presence of nonperiodic noise in both fits is also obvious.
Nevertheless, we tried to derive the separate values of Ω for two sets of polarization data in order to estimate the significance of the difference between them. To estimate confidence intervals for the values of Ω, we employed the method described in the previous section. The corresponding 1σ and 2σ confidence intervals are shown in Fig. 7. The resulting values of Ω are presented in Table 5. As is seen from Fig. 7, 2σ confidence intervals for derived Ω for the orbit inclination i above 135° (or below 45°) are extending up to (−180°, +180°). Thus, although analysis of our polarization data do show some evidence of apsidal motion, we cannot reliably estimate its rate due to large uncertainty in value of Ω derived from our polarization data.
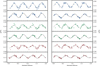 |
Fig. 6 Variability in the observed Stokes parameters q and u for HD 165052 in the B, V, and R passbands (top two, middle two, and bottom two panels, respectively), phase-folded with the orbital period, 2.95510 d. The dotted (dashed) Fourier fit curves and data points represented with circles (squares) show the data obtained in 2012 (2023). Best-fit Fourier coefficients for the two datasets are given in Table 4. The lengths of the bars correspond to ±σ errors. |
3.6 Determination of the mass-loss rate
Because HD 165052 is an O-type binary, the most likely cause for the polarization variations is the electron scattering in the stellar winds of the hot components. Strong evidence of the presence of the hot shocked gas region due to wind–wind interaction in HD 165052 was already presented by Arias et al. (2002) from their analysis of ROSAT data. The presence of a real stochastic variability in polarization of HD 165052 is also quite obvious. The natural explanation for this phenomenon is highly clumped radiatively driven stellar winds, which are not uncommon in early-type binaries consisting of O-type components.
It is possible to estimate the mass-loss rate from the component(s) in an early-type binary using polarization variability amplitude, employing the method proposed by St.-Louis et al. (1988). The method utilizes the polarization variability amplitude Ap, defined by Brown et al. (1978) as
![$\[A_{\mathrm{p}}=\tau_0 H\left(1+\cos ^2 i\right),\]$](/articles/aa/full_html/2025/05/aa52778-24/aa52778-24-eq5.png) (4)
(4)
where τ0H is a measure of the optical depth moment and the scattering geometry of the stellar wind, and i is the orbital inclination. The values of Ap determined from our Fourier fits are 0.043%, 0.032%, and 0.027% for the B, V, and R passbands, respectively. Although electron scattering is independent of wavelength and should yield equal amplitudes, differences may arise from dilution effects caused by unpolarized radiation from the gaseous disk or envelope.
As shown by St. -Louis et al. (1988), in the case of a Wolfe–Rayet (WR)+O system, the mass-loss rate due to stellar wind from the primary component can be estimated using the following formula:
![$\[\dot{M}=\frac{(16 \pi)^2 m_{\mathrm{p}} v_{\infty} a A_{\mathrm{p}}}{\left(1+\cos ^2 i\right) 3 \sigma_{\mathrm{t}} f_{\mathrm{c}} I},\]$](/articles/aa/full_html/2025/05/aa52778-24/aa52778-24-eq6.png) (5)
(5)
where ![$\[\dot{M}\]$](/articles/aa/full_html/2025/05/aa52778-24/aa52778-24-eq7.png) is the mass-loss rate, fc is the fraction of total light from the companion star, v∞ is the wind terminal velocity, a is the semimajor axis, mp is mass of proton, σt is Thomson cross section, and I is a specific integral. Evaluating this integral requires choosing a specific wind velocity law characterized by the parameter β. In mass-loss rate calculations for massive stars in binary systems, the polarization amplitude Ap is directly related to the wind properties and mass-loss rates of the stars. The observed polarization in a binary system is influenced by the combined light from the two stars, but the manner in which each star contributes depends on the system type.
is the mass-loss rate, fc is the fraction of total light from the companion star, v∞ is the wind terminal velocity, a is the semimajor axis, mp is mass of proton, σt is Thomson cross section, and I is a specific integral. Evaluating this integral requires choosing a specific wind velocity law characterized by the parameter β. In mass-loss rate calculations for massive stars in binary systems, the polarization amplitude Ap is directly related to the wind properties and mass-loss rates of the stars. The observed polarization in a binary system is influenced by the combined light from the two stars, but the manner in which each star contributes depends on the system type.
In a WR+O binary system, the WR star’s strong stellar wind serves as the primary source of polarization, while the O-type companion, despite contributing to the total light of the binary system, has a much weaker wind. Consequently, the observed polarization is primarily due to photons from the O-star scattering off free electrons in the WR wind. The WR star’s light originates from a dense, optically thick wind, where multiple scattering events occur, effectively averaging out any intrinsic polarization under the assumption of spherical symmetry. In contrast, the companion’s light travels asymmetrically through the WR wind, undergoing single scattering, which generates net polarization. However, the observed polarization is diluted by the unpolarized light from the WR star. To correct for this dilution when deriving the WR star’s mass-loss rate (![$\[\dot{M}\]$](/articles/aa/full_html/2025/05/aa52778-24/aa52778-24-eq8.png) ), the observed polarization amplitude (Ap) is divided by the fractional light contribution of the O star (fc).
), the observed polarization amplitude (Ap) is divided by the fractional light contribution of the O star (fc).
In contrast, for an O+O binary system, the two stars contribute comparably to the observed polarization. Since the two stars have a similar luminosity and wind strength, their individual contributions to the total polarization and dilution are roughly equal. Therefore, we assumed fc = 0.5. Moreover, we also accounted for the difference in wind composition between the O-type star wind and the WR star wind. The wind of the WR star is composed of He, while the O-type star wind is composed of both H and He, but is mostly dominated by H. In the case of fully ionized He, each He nucleus contains two electrons per four nucleons, that is, αWR = 2/4 = 0.5 as given by St. -Louis et al. (1988). For fully ionized H, the ratio is 1:1. We assumed that the O-star wind consists of 90% of H and 10% of He, and we have an electron/nucleon ratio of ~1.0. Thus, the formula for the mass-loss rate per component in HD 165052 system becomes
![$\[\begin{aligned}&\dot{M}=\frac{(16 \pi)^2 m_{\mathrm{p}} v_{\infty} a A_{\mathrm{p}}}{\left(1+\cos ^2 i\right) 3 \sigma_{\mathrm{t}} f_{\mathrm{c}} I} \cdot \frac{1}{2},\\&\text { or }\\&\dot{M}\left[M_{\odot} \mathrm{yr}^{-1}\right]=\frac{1.16 \times 10^{-7} v_{\infty}\left(\mathrm{km} \mathrm{~s}^{-1}\right) a\left(R_{\odot}\right) A_{\mathrm{p}}}{\left(1+\cos ^2 i\right) f_{\mathrm{c}} I}.\end{aligned}\]$](/articles/aa/full_html/2025/05/aa52778-24/aa52778-24-eq9.png) (6)
(6)
We could then estimate ![$\[\dot{M}\]$](/articles/aa/full_html/2025/05/aa52778-24/aa52778-24-eq10.png) by using the observed polarization variability amplitude Ap and the orbital inclination i = 22.7° ± 0.6° from Rosu et al. (2023). The wind velocity v∞ = 2335 km s−1 for both components, as determined from combined IUE (International Ultraviolet Explorer) spectra from Howarth et al. (1997), is used.
by using the observed polarization variability amplitude Ap and the orbital inclination i = 22.7° ± 0.6° from Rosu et al. (2023). The wind velocity v∞ = 2335 km s−1 for both components, as determined from combined IUE (International Ultraviolet Explorer) spectra from Howarth et al. (1997), is used.
For primary component: ap sin i = 5.66 ± 0.04 R⊙, R*,p = 7.0 + 0.5/−0.4 R⊙, give ap/R*,p = 2.1, and for secondary component: as sin i = 6.27 ± 0.06 R⊙, R*,s = 6.2 + 0.4/−0.3 R⊙, give as/R*,s = 2.6 (Rosu et al. 2023). We assumed ![$\[\epsilon=R_{\mathrm{i}}^{\prime} / R_{*}=1.0\]$](/articles/aa/full_html/2025/05/aa52778-24/aa52778-24-eq11.png) (optically thin scattering envelope). We chose β = 0.8, as suggested by Abbott et al. (1986) and Corcoran (1991) for O-type stars. By using these values, we selected integral values of Ip = 12.6 and Is = 12.3 from the plot given by St. -Louis et al. (1988, Fig. 9 therein) for the primary and secondary components, respectively. In order to obtain uncertainty estimates on derived values of
(optically thin scattering envelope). We chose β = 0.8, as suggested by Abbott et al. (1986) and Corcoran (1991) for O-type stars. By using these values, we selected integral values of Ip = 12.6 and Is = 12.3 from the plot given by St. -Louis et al. (1988, Fig. 9 therein) for the primary and secondary components, respectively. In order to obtain uncertainty estimates on derived values of ![$\[\dot{M}\]$](/articles/aa/full_html/2025/05/aa52778-24/aa52778-24-eq12.png) , we used the method of error propagations, as suggested by St. -Louis et al. (1988).
, we used the method of error propagations, as suggested by St. -Louis et al. (1988).
For each observed band (B, V, and R), we calculated the mass-loss rates for both stars and the total mass-loss rate is then obtained by summing these contributions. Uncertainties for each component are also propagated, providing a robust estimate of the total mass-loss rate for the system:
B band
Primary: 1.465 × 10⁻⁷ ± 3.188 × 10⁻⁸ M⊙ yr−1,
Secondary: 1.644 × 10⁻⁷ ± 3.581 × 10⁻⁸ M⊙ yr−1,
Total: 3.109 × 10⁻⁷ ± 4.795 × 10⁻⁸ M⊙ yr−1.
V band:
Primary: 1.090 × 10⁻⁷ ± 2.990 × 10⁻⁸ M⊙ yr−1,
Secondary: 1.223 × 10⁻⁷ ± 3.358 × 10⁻⁸ M⊙ yr−1,
Total: 2.313 × 10⁻⁷ ± 4.496 × 10⁻⁸ M⊙ yr−1.
R band:
Primary: 9.198 × 10⁻⁸ ± 2.293 × 10⁻⁸ M⊙ yr−1,
Secondary: 1.032 × 10⁻⁷ ± 2.575 × 10⁻⁸ M⊙ yr−1,
Total: 1.952 × 10⁻⁷ ± 3.448 × 10⁻⁸ M⊙ yr−1.
This gives the average value over three passbands as 2.46 × 10⁻⁷ ± 2.47 × 10⁻⁸ M⊙ yr−1. Our estimation of ![$\[\dot{M}\]$](/articles/aa/full_html/2025/05/aa52778-24/aa52778-24-eq13.png) is in good agreement with previously derived mass-loss rate of
is in good agreement with previously derived mass-loss rate of ![$\[\dot{M}\]$](/articles/aa/full_html/2025/05/aa52778-24/aa52778-24-eq14.png) = 2.24 × 10⁻⁷ M⊙ yr−1. published by Chlebowski & Garmany (1991). The decrease in
= 2.24 × 10⁻⁷ M⊙ yr−1. published by Chlebowski & Garmany (1991). The decrease in ![$\[\dot{M}\]$](/articles/aa/full_html/2025/05/aa52778-24/aa52778-24-eq15.png) from the B to R passbands is due to decrease in Ap with the wavelength. Thomson scattering is a gray process, but there is an additional dilution of scattered polarized radiation due to free-free emission arising in the gaseous disk or shell. Contribution from this emission increases toward the near-infrared. Thus, we expect that our upper estimate, obtained for the B-band, is least affected by this dilution and probably is more reliable.
from the B to R passbands is due to decrease in Ap with the wavelength. Thomson scattering is a gray process, but there is an additional dilution of scattered polarized radiation due to free-free emission arising in the gaseous disk or shell. Contribution from this emission increases toward the near-infrared. Thus, we expect that our upper estimate, obtained for the B-band, is least affected by this dilution and probably is more reliable.
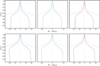 |
Fig. 7 Confidence intervals (solid lines for ±1σ, and dotted lines for ±2σ) of Ω for the 2012 dataset (upper panels) with γ values of 185, 70, and 72 for the B, V, and R passbands (left, middle, and right panels, respectively), and for 2023 dataset (lower panels) with γ values of 145,240, and 171. Note that confidence intervals for season 2012 are somewhat narrower due to the larger number of data points and, therefore, better phase coverage. |
4 Conclusions
Our comprehensive polarimetric study of the O+O spectral type binary HD 165052 has clearly revealed the presence of periodic polarization variability. Using Lomb–Scargle periodograms, we unambiguously determine an orbital period value of 2.95510 d. This value is in good agreement with the previously determined values of the orbital period, 2.95510 d (Arias et al. 2002) and 2.95515 d (Linder et al. 2007). The most plausible mechanism of polarization variability is the Thomson scattering of light in the interacting stellar winds. Our polarimetry of the field stars in the near vicinity of HD 165052 reveals complex and strongly nonuniform pattern of IS polarization in the cluster NGC 6530. Our multiwavelength observations show that in addition to variations in dust particle density and orientations, variations in particle size and composition can also occur.
Polarization variability in HD 165052 is dominated by the second harmonics of the orbital period. This indicates a nearly symmetric scattering material geometry and a high concentration of light-scattering material toward the orbital plane. Based on a refined Fourier fit, we derived the average values of the orbital parameters, orbital inclination i = 55° + 5°/−55° and Ω = 148°(328°) + 20°/−22°, averaged over the B, V, and R passbands. The direction of orbital motion in the sky is clockwise. Using the values of polarization periodic variability amplitude, we estimated the total mass-loss rate of the binary system to be ![$\[\dot{M}\]$](/articles/aa/full_html/2025/05/aa52778-24/aa52778-24-eq16.png) = 2.46 × 10⁻⁷ ± 2.47 × 10⁻⁸ M⊙ yr−1.
= 2.46 × 10⁻⁷ ± 2.47 × 10⁻⁸ M⊙ yr−1.
We have demonstrated that the BME analytic solution is not able to reliably constrain the inclination of the orbit for low-inclination systems in the presence of nonperiodic noise in polarization variability. Nevertheless, high-precision polarization data can still be used to obtain reliable independent estimates of the orbital period and mass-loss rates. Numerical modeling may provide better estimates because it accounts for component sizes, their separation, and relevant scattering scenarios.
Data availability
The observed polarimetric data used in this paper is available at the CDS via anonymous ftp to cdsarc.cds.unistra.fr (130.79.128.5) or via https://cdsarc.cds.unistra.fr/viz-bin/cat/J/A+A/697/A133
Acknowledgements
This work was supported by the ERC Advanced Grant Hot-Mol ERC-2011-AdG-291659 (www.hotmol.eu). DiPol-2 was built in the cooperation between the University of Turku, Finland, and the Kiepenheuer Institutfür Sonnenphysik, Germany, with the support by the Leibniz Association grant SAW-2011-KIS-7. We are grateful to the Institute for Astronomy, University of Hawaii for the observing time allocated for us on the T60 telescope at the Haleakalā Observatory. All raw data and calibrations images are available on request from the authors.
Appendix A Tables
Polarimetric observations for HD 165052.
Average polarization degrees (P) and polarization angles (θ) of highly polarized stars.
Numbers, identifiers, coordinates, parallaxes, distances, reddening magnitudes, polarization degrees, polarization angles, and the number of polarimetric observations of the field stars.
Appendix B Formulae
The formulae from Drissen et al. (1986) are provided in this section. For the orbital inclination (i):
![$\[\begin{aligned}\left(\frac{1-\cos i}{1+\cos i}\right)^4 & =\frac{\left(u_1+q_2\right)^2+\left(u_2-q_1\right)^2}{\left(u_2+q_1\right)^2+\left(u_1-q_2\right)^2} \\& =\frac{\left(u_3+q_4\right)^2+\left(u_4-q_3\right)^2}{\left(u_4+q_3\right)^2+\left(u_3-q_4\right)^2}.\end{aligned}\]$](/articles/aa/full_html/2025/05/aa52778-24/aa52778-24-eq17.png) (B.1)
(B.1)
The longitude of the ascending node (Ω) can be computed as
![$\[\tan~ \Omega=\frac{A+B}{C+D}=\frac{C-D}{A-B},\]$](/articles/aa/full_html/2025/05/aa52778-24/aa52778-24-eq18.png) (B.2)
(B.2)
![$\[\begin{array}{ll}A=\frac{u_4-q_3}{(1-~\cos~ i)^2}, & B=\frac{u_4+q_3}{(1+~\cos~ i)^2}, \\C=\frac{q_4-u_3}{(1+~\cos~ i)^2}, & D=\frac{u_3+q_4}{(1-~\cos~ i)^2}.\end{array}\]$](/articles/aa/full_html/2025/05/aa52778-24/aa52778-24-eq19.png)
The following formulae can be used to derive Aq and Au:
![$\[A_{\mathrm{q}}=\left(\frac{q_3^2+q_4^2}{q_1^2+q_2^2}\right)^{\frac{1}{2}}\left(\frac{J^2+K^2}{N^2+R^2}\right)^{\frac{1}{2}}, \quad A_{\mathrm{u}}=\left(\frac{u_3^2+u_4^2}{u_1^2+u_2^2}\right)^{\frac{1}{2}}\left(\frac{E^2+F^2}{L^2+M^2}\right)^{\frac{1}{2}},\]$](/articles/aa/full_html/2025/05/aa52778-24/aa52778-24-eq20.png) (B.4)
(B.4)
![$\[\begin{aligned}& E=~\sin~ 2 i ~\cos~ \Omega, \quad F=2 ~\sin~ i ~\sin~ \Omega, \quad J=~\sin~ 2 i ~\sin~ \Omega, \quad K=2 ~\sin~ i ~\cos~ \Omega, \\& L=\left(1+~\cos~ ^2 i\right) ~\cos~ \Omega, \quad M=2 ~\cos~ i ~\sin~ \Omega, \quad N=\left(1+~\cos~ ^2 i\right) ~\sin~ \Omega, \quad R=2 ~\cos~ i ~\cos~ \Omega.\end{aligned}\]$](/articles/aa/full_html/2025/05/aa52778-24/aa52778-24-eq21.png)
We computed the moment τ0H as follows:
![$\[\tau_0 H=\left(\frac{q_3^2+q_4^2}{L^2+M^2}\right)^{\frac{1}{2}}=\left(\frac{u_3^2+u_4^2}{N^2+R^2}\right)^{\frac{1}{2}}.\]$](/articles/aa/full_html/2025/05/aa52778-24/aa52778-24-eq22.png) (B.6)
(B.6)
References
- Abbott, D. C., Beiging, J. H., Churchwell, E., & Torres, A. V. 1986, ApJ, 303, 239 [NASA ADS] [CrossRef] [Google Scholar]
- Abdul Qadir, Y., Berdyugin, A. V., Piirola, V., Sakanoi, T., & Kagitani, M. 2023a, A&A, 670, A176 [NASA ADS] [CrossRef] [EDP Sciences] [Google Scholar]
- Abdul Qadir, Y., Berdyugin, A. V., Piirola, V., Sakanoi, T., & Kagitani, M. 2023b, A&A, 677, A75 [NASA ADS] [CrossRef] [EDP Sciences] [Google Scholar]
- Arias, J. I., Morrell, N. I., Barbá, R. H., et al. 2002, MNRAS, 333, 202 [NASA ADS] [CrossRef] [Google Scholar]
- Aspin, C., Simmons, J. F. L., & Brown, J. C. 1981, MNRAS, 194, 283 [CrossRef] [Google Scholar]
- Berdyugin, A., Piirola, V., Sadegi, S., et al. 2016, A&A, 591, A92 [Google Scholar]
- Brown, J. C., McLean, I. S., & Emslie, A. G. 1978, A&A, 68, 415 [NASA ADS] [Google Scholar]
- Chlebowski, T., & Garmany, C. D. 1991, ApJ, 368, 241 [NASA ADS] [CrossRef] [Google Scholar]
- Corcoran, M. F. 1991, ApJ, 366, 308 [NASA ADS] [CrossRef] [Google Scholar]
- Damiani, F., Prisinzano, L., Micela, G., & Sciortino, S. 2006, A&A, 459, 477 [NASA ADS] [CrossRef] [EDP Sciences] [Google Scholar]
- Drissen, L., Lamontagne, R., Moffat, A. F. J., Bastien, P., & Seguin, M. 1986, ApJ, 304, 188 [NASA ADS] [CrossRef] [Google Scholar]
- Ferrero, G., Gamen, R., Benvenuto, O., & Fernández-Lajús, E. 2013, MNRAS, 433, 1300 [Google Scholar]
- Gaia Collaboration (Brown, A. G. A., et al.) 2021, A&A, 649, A1 [NASA ADS] [CrossRef] [EDP Sciences] [Google Scholar]
- Hogg, D. W., & Foreman-Mackey, D. 2018, ApJS, 236, 11 [NASA ADS] [CrossRef] [Google Scholar]
- Howarth, I. D., Siebert, K. W., Hussain, G. A. J., & Prinja, R. K. 1997, MNRAS, 284, 265 [NASA ADS] [CrossRef] [Google Scholar]
- Kosenkov, I. A., & Veledina, A. 2018, MNRAS, 478, 4710 [NASA ADS] [CrossRef] [Google Scholar]
- Linder, N., Rauw, G., Sana, H., De Becker, M., & Gosset, E. 2007, A&A, 474, 193 [NASA ADS] [CrossRef] [EDP Sciences] [Google Scholar]
- Lomb, N. R. 1976, Ap&SS, 39, 447 [Google Scholar]
- Manset, N., & Bastien, P. 2000, AJ, 120, 413 [NASA ADS] [CrossRef] [Google Scholar]
- Morrison, N. D., & Conti, P. S. 1978, ApJ, 224, 558 [Google Scholar]
- Piirola, V., Berdyugin, A., & Berdyugina, S. 2014, SPIE Conf. Ser., 9147, 91478I [NASA ADS] [Google Scholar]
- Piirola, V., Berdyugin, A., Frisch, P. C., et al. 2020, A&A, 635, A46 [NASA ADS] [CrossRef] [EDP Sciences] [Google Scholar]
- Piirola, V., Kosenkov, I. A., Berdyugin, A. V., Berdyugina, S. V., & Poutanen, J. 2021, AJ, 161, 20 [Google Scholar]
- Price-Whelan, A., Crawford, S., Sipocz, B., et al. 2018, https://doi.org/10.5281/zenodo.1211397 [Google Scholar]
- Rosu, S., Quintero, E. A., Rauw, G., & Eenens, P. 2023, MNRAS, 521, 2988 [NASA ADS] [CrossRef] [Google Scholar]
- Scargle, J. D. 1982, ApJ, 263, 835 [Google Scholar]
- Schmidt, G. D., Elston, R., & Lupie, O. L. 1992, AJ, 104, 1563 [Google Scholar]
- Shannon, C. E. 1949, IEEE Proc., 37, 10 [NASA ADS] [Google Scholar]
- Simmons, J. F. L., Aspin, C., & Brown, J. C. 1982, MNRAS, 198, 45 [NASA ADS] [CrossRef] [Google Scholar]
- -Louis, N.St., Moffat, A. F. J., Drissen, L., Bastien, P., & Robert, C. 1988, ApJ, 330, 286 [NASA ADS] [CrossRef] [Google Scholar]
- Stickland, D. J., Lloyd, C., & Koch, R. H. 1997, The Observatory, 117, 295 [NASA ADS] [Google Scholar]
- Sung, H., Chun, M.-Y., & Bessell, M. S. 2000, AJ, 120, 333 [Google Scholar]
- Suveges, M. 2012, in Seventh Conference on Astronomical Data Analysis, eds. J.-L. Starck, & C. Surace, 16 [Google Scholar]
- Topasna, G. A., Jones, R. H., & Kaltcheva, N. T. 2020, PASP, 132, 044301 [Google Scholar]
- VanderPlas, J. T. 2018, ApJS, 236, 16 [Google Scholar]
- Wolinski, K. G., & Dolan, J. F. 1994, MNRAS, 267, 5 [CrossRef] [Google Scholar]
All Tables
FAPs for the real and alias periods obtained for HD 165052 from the period search.
Orbital parameters for HD 165052 derived from the polarization measurements in the B, V, and R passbands.
Best-fit Fourier coefficients for Stokes q and u for data obtained in 2012 (upper panel) and 2023 (lower panel).
Orbital parameter Ω for HD 165052 derived for the B, V, and R passbands for data obtained in 2012 (upper panel) and 2023 (lower panel).
Average polarization degrees (P) and polarization angles (θ) of highly polarized stars.
Numbers, identifiers, coordinates, parallaxes, distances, reddening magnitudes, polarization degrees, polarization angles, and the number of polarimetric observations of the field stars.
All Figures
|
Fig. 1 Lomb–Scargle periodograms for Stokes q (left column) and u (right column) for HD 165052 obtained in the B, V, and R passbands (top, middle, and bottom panels, respectively). |
| In the text | |
|
Fig. 2 IS polarization map in the vicinity of HD 165052. Measurements made in the V passband are presented. The binary is in the center of the field, and its average value of polarization is shown with the thicker black line. The length of the bars corresponds to the degree of linear polarization, P, and the direction corresponds to the polarization angle (measured from the north to the east). |
| In the text | |
|
Fig. 3 Variability in the observed Stokes parameters q and u for HD 165052 in the B, V, and R passbands (top, middle, and bottom panels, respectively), phase-folded with the orbital period, 2.95510 d. Fourier fit curves (see Sect. 3.3) are shown with solid lines, and the best-fit Fourier coefficients are given in Table 2. The lengths of the bars correspond to ±σ errors. |
| In the text | |
|
Fig. 4 Confidence intervals (solid lines for ±1σ and dotted lines for ±2σ) of i (upper panels) and Ω (lower panels) for γ values of 316, 265, and 222 for the B, V, and R passbands (left, middle, and right panels, respectively). The dotted lines in upper panels illustrate critical values of i. Note that the inclination range of 180°–90° shown in the plots is fully equivalent to 0°–90°. If the orbital rotation as seen on the plane of the sky is clockwise, the BME method yields inclination values between 90° and 180°. |
| In the text | |
|
Fig. 5 Variability in the observed polarization for HD 165052 plotted on the Stokes (q, u) plane, represented by the ellipses of second harmonics of the Fourier fit. Blue, green, and red represent B, V, and R passbands, respectively. The clockwise direction and phases of the orbital period are shown for the B band ellipse. The angle between the major axis and the q-axis gives the orientation, Ω. |
| In the text | |
|
Fig. 6 Variability in the observed Stokes parameters q and u for HD 165052 in the B, V, and R passbands (top two, middle two, and bottom two panels, respectively), phase-folded with the orbital period, 2.95510 d. The dotted (dashed) Fourier fit curves and data points represented with circles (squares) show the data obtained in 2012 (2023). Best-fit Fourier coefficients for the two datasets are given in Table 4. The lengths of the bars correspond to ±σ errors. |
| In the text | |
|
Fig. 7 Confidence intervals (solid lines for ±1σ, and dotted lines for ±2σ) of Ω for the 2012 dataset (upper panels) with γ values of 185, 70, and 72 for the B, V, and R passbands (left, middle, and right panels, respectively), and for 2023 dataset (lower panels) with γ values of 145,240, and 171. Note that confidence intervals for season 2012 are somewhat narrower due to the larger number of data points and, therefore, better phase coverage. |
| In the text | |
Current usage metrics show cumulative count of Article Views (full-text article views including HTML views, PDF and ePub downloads, according to the available data) and Abstracts Views on Vision4Press platform.
Data correspond to usage on the plateform after 2015. The current usage metrics is available 48-96 hours after online publication and is updated daily on week days.
Initial download of the metrics may take a while.