Fig. 4
Download original image
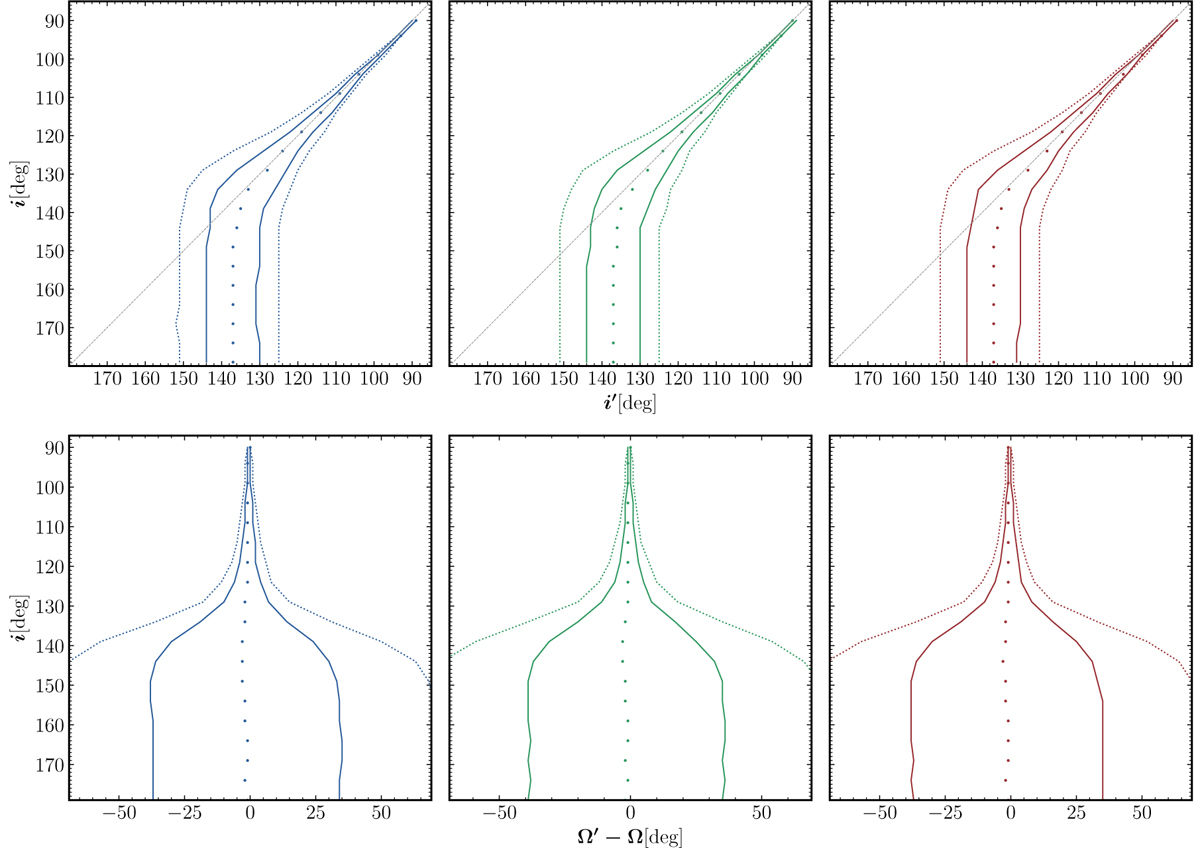
Confidence intervals (solid lines for ±1σ and dotted lines for ±2σ) of i (upper panels) and Ω (lower panels) for γ values of 316, 265, and 222 for the B, V, and R passbands (left, middle, and right panels, respectively). The dotted lines in upper panels illustrate critical values of i. Note that the inclination range of 180°–90° shown in the plots is fully equivalent to 0°–90°. If the orbital rotation as seen on the plane of the sky is clockwise, the BME method yields inclination values between 90° and 180°.
Current usage metrics show cumulative count of Article Views (full-text article views including HTML views, PDF and ePub downloads, according to the available data) and Abstracts Views on Vision4Press platform.
Data correspond to usage on the plateform after 2015. The current usage metrics is available 48-96 hours after online publication and is updated daily on week days.
Initial download of the metrics may take a while.