Fig. 5
Download original image
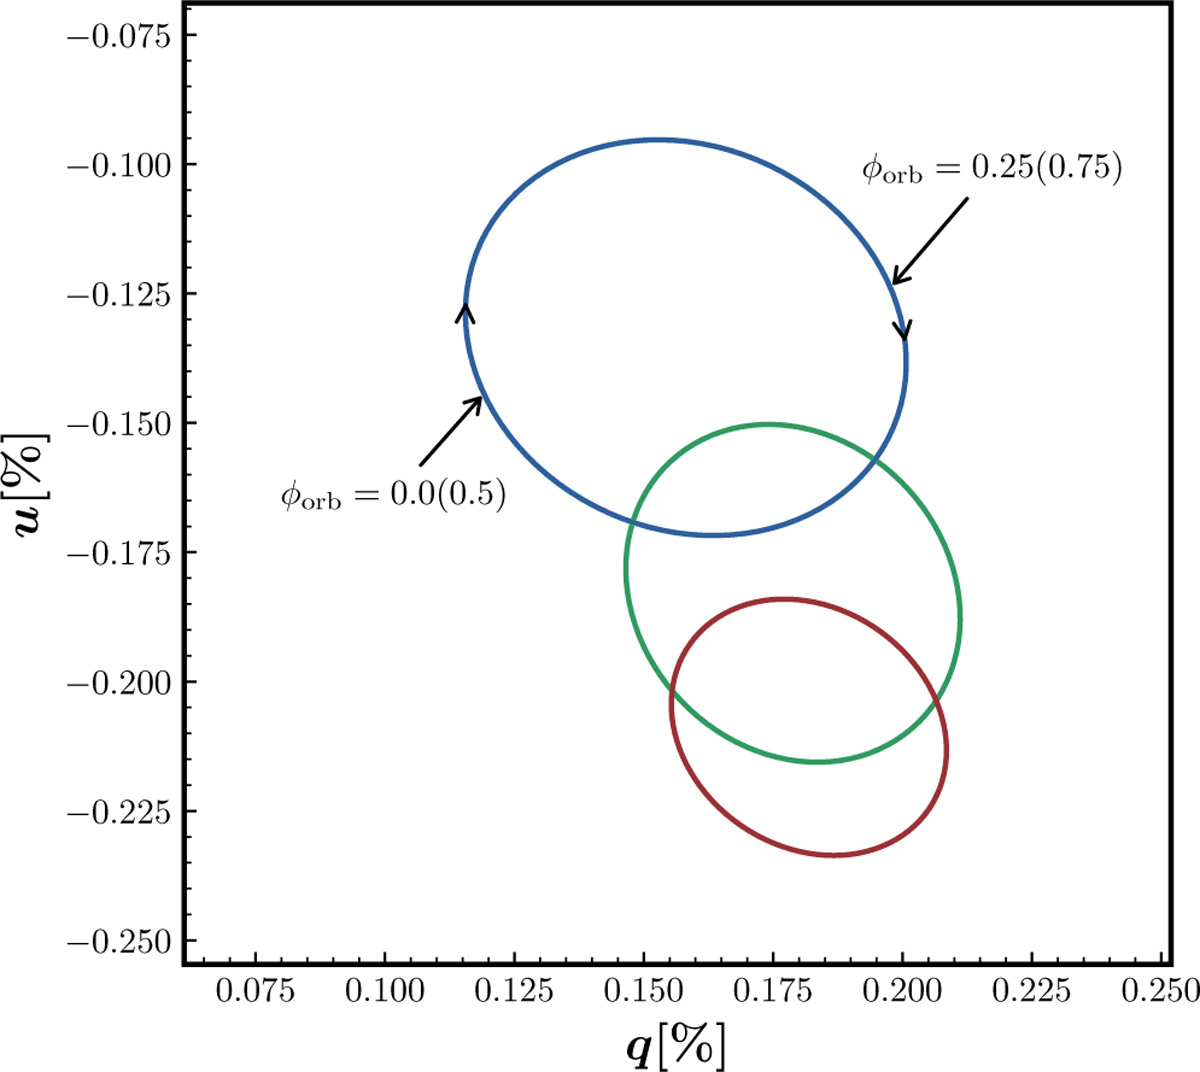
Variability in the observed polarization for HD 165052 plotted on the Stokes (q, u) plane, represented by the ellipses of second harmonics of the Fourier fit. Blue, green, and red represent B, V, and R passbands, respectively. The clockwise direction and phases of the orbital period are shown for the B band ellipse. The angle between the major axis and the q-axis gives the orientation, Ω.
Current usage metrics show cumulative count of Article Views (full-text article views including HTML views, PDF and ePub downloads, according to the available data) and Abstracts Views on Vision4Press platform.
Data correspond to usage on the plateform after 2015. The current usage metrics is available 48-96 hours after online publication and is updated daily on week days.
Initial download of the metrics may take a while.