Fig. 9
Download original image
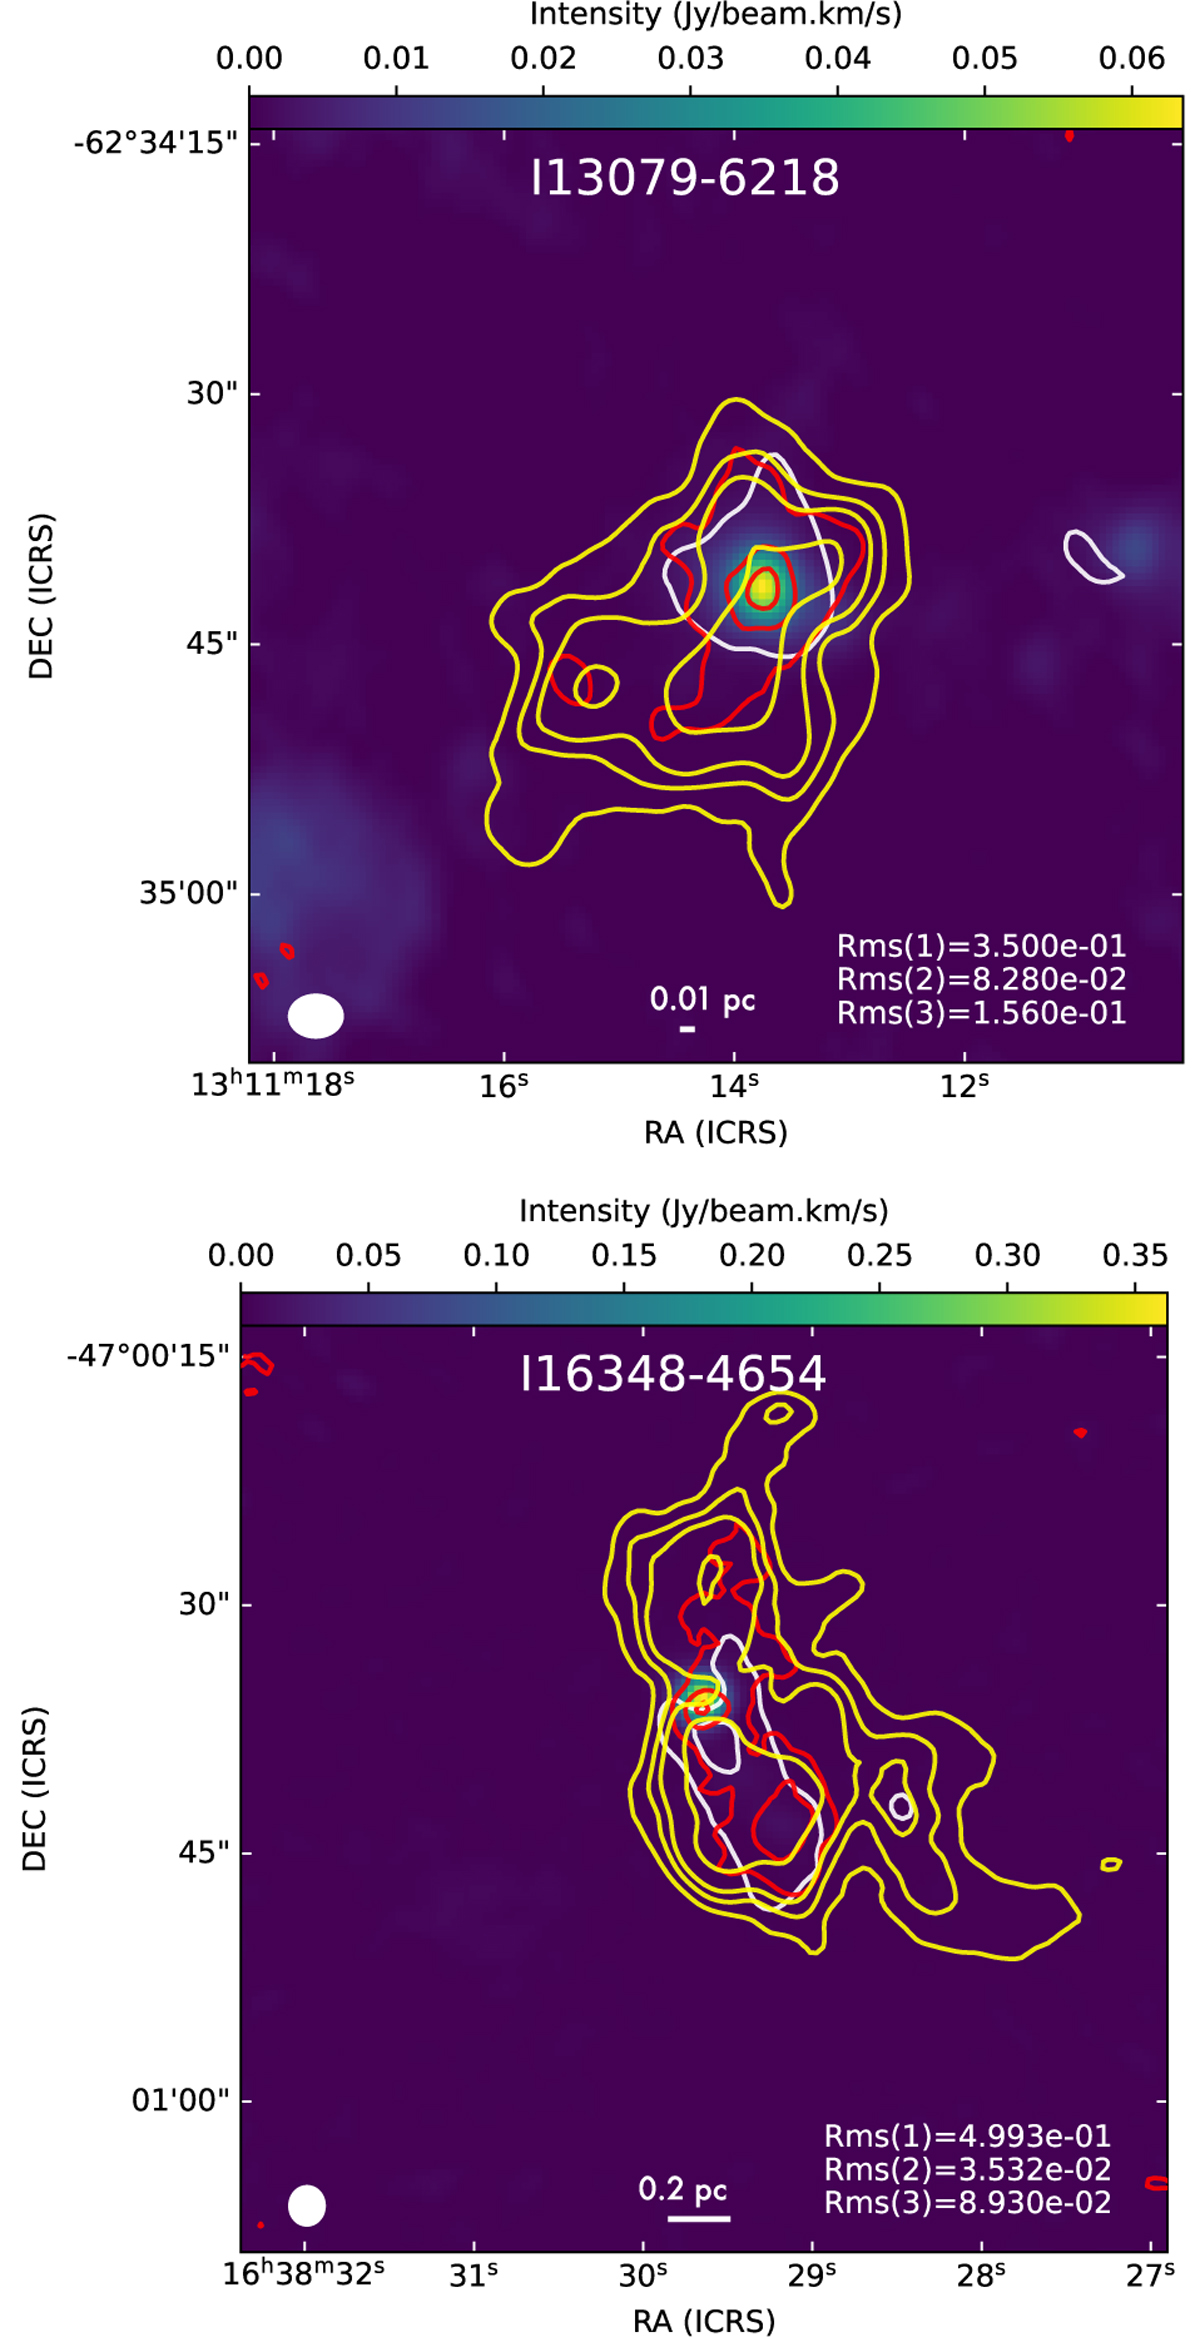
Comparison of moment 0 maps of CH3CHO (after spectral stacking), SiO, and H13CO+. The background emission shows 3 mm continuum emission. The white, yellow and red contours are for H13CO+ emission, SiO, and CH3CHO, respectively. Their contour levels are [5, 10, 15, 30, 50, 100, 200] × Rms(1, 2, 3). Rms(1), Rms(2) and Rms(3) are shown in the lower right corners, representing the noise values for CH3CHO, SiO, and H13CO+, respectively, with units of Kelvin kilometers per second. The beam of continuum emission is placed in the lower left corner of the image.
Current usage metrics show cumulative count of Article Views (full-text article views including HTML views, PDF and ePub downloads, according to the available data) and Abstracts Views on Vision4Press platform.
Data correspond to usage on the plateform after 2015. The current usage metrics is available 48-96 hours after online publication and is updated daily on week days.
Initial download of the metrics may take a while.