Fig. 8
Download original image
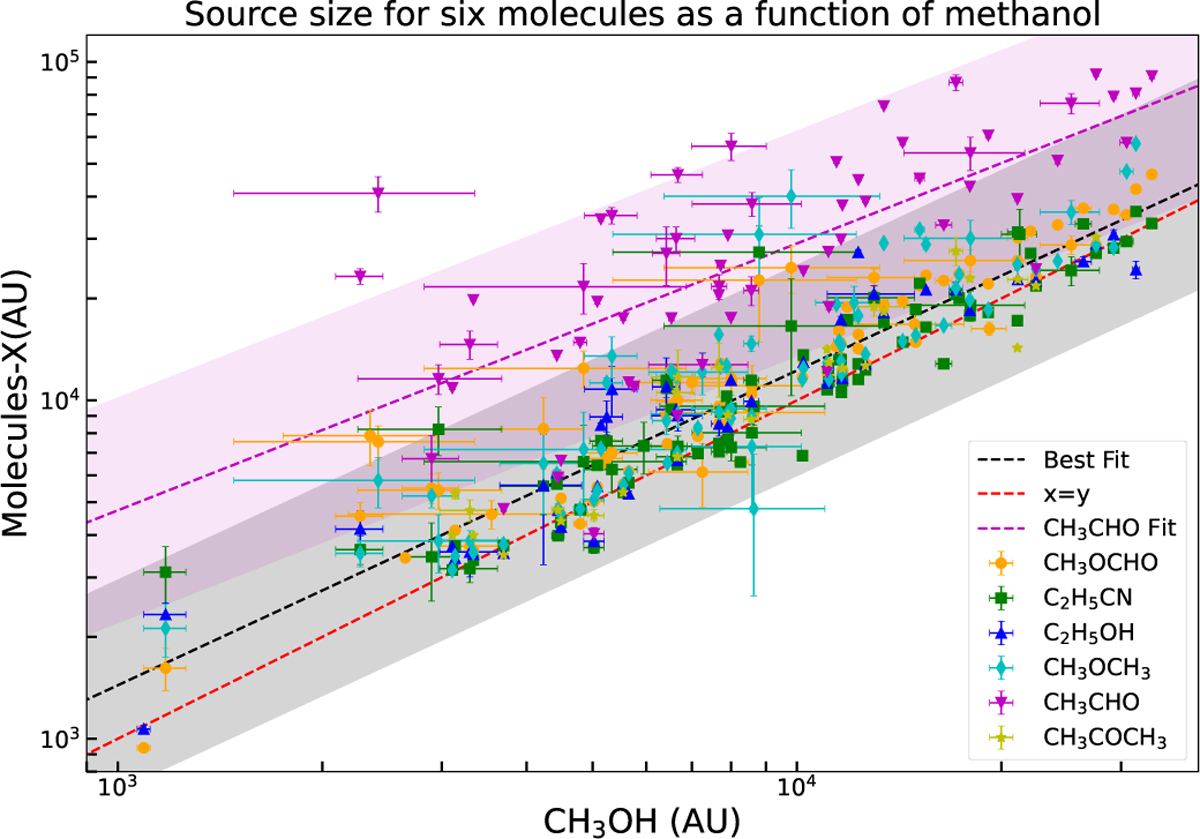
Relation between the beam-deconvolved sizes (in log scale) of hot core candidates for different species, with the x and y axes values representing the core sizes of CH3OH and the other six species, respectively. The dashed red line represents y = x. The dashed black line shows the linear fit of all data points, except those of CH3CHO. The dashed pink line shows the linear fit of the CH3CHO data. The shaded regions indicate the standard deviation range of the data.
Current usage metrics show cumulative count of Article Views (full-text article views including HTML views, PDF and ePub downloads, according to the available data) and Abstracts Views on Vision4Press platform.
Data correspond to usage on the plateform after 2015. The current usage metrics is available 48-96 hours after online publication and is updated daily on week days.
Initial download of the metrics may take a while.