Fig. 7

Download original image
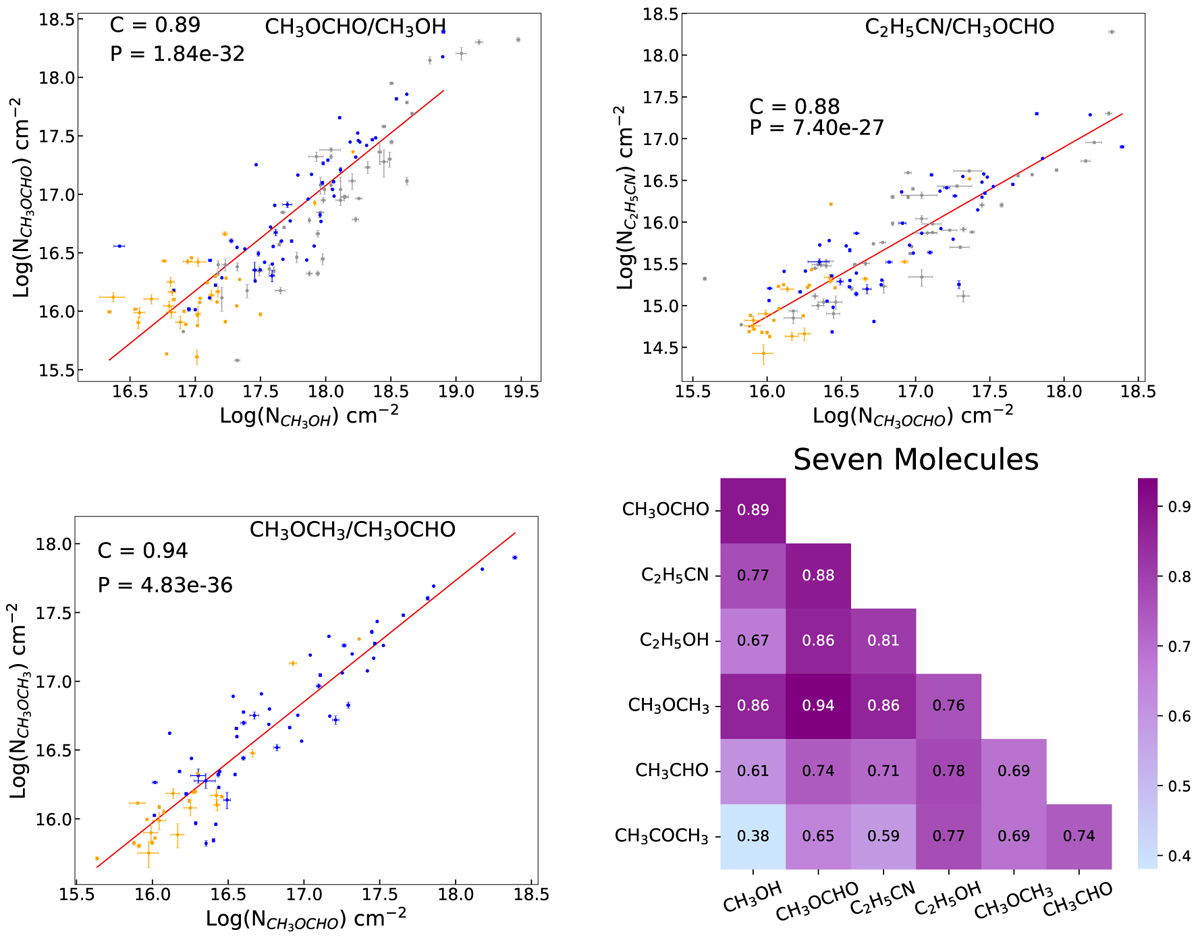
Comparison of the column density correlations among the seven molecules. The first three panels show the correlations of molecular column densities, with the red lines representing the linear fit in log scale. The correlation coefficients (labeled as ‘C’ in the upper left corner) are displayed in each panel. Blue and yellow points represent the column densities obtained through stacking of the 60 strong hot cores and 40 weak candidates, respectively. Gray points indicate the column densities of strong hot cores fit by Qin et al. (2022). The bottom right panel displays the correlation coefficients between all species. Each cell is colored, with a deeper color representing a higher correlation coefficient. The p value, which is also displayed in each panel, quantifies the statistical significance of the observed correlation. A smaller p value (typically <0.05) indicates a stronger, more statistically significant correlation, while larger p value suggest weaker or less significant relationships between the variables.
Current usage metrics show cumulative count of Article Views (full-text article views including HTML views, PDF and ePub downloads, according to the available data) and Abstracts Views on Vision4Press platform.
Data correspond to usage on the plateform after 2015. The current usage metrics is available 48-96 hours after online publication and is updated daily on week days.
Initial download of the metrics may take a while.


