Fig. 6
Download original image
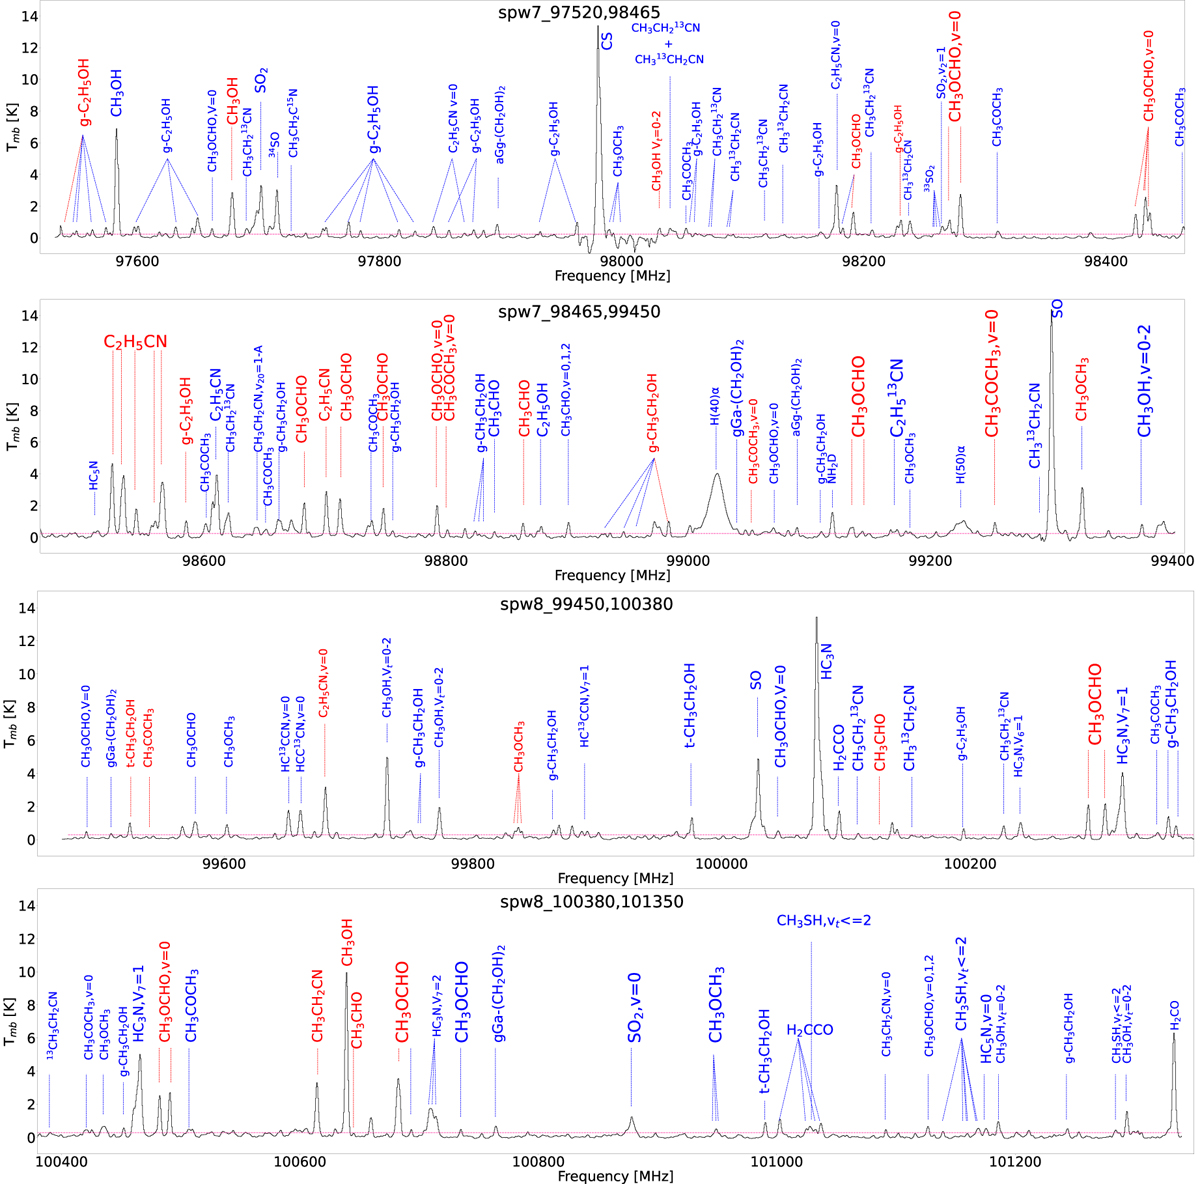
Spectrum averaged over all 100 hot core candidates (Sect. 4.1). The transitions identified in the averaged spectrum (see Table B.1) are labeled with the corresponding species names. The transitions selected for spectral stacking (Sect. 3.1.2) in this work are marked with red labels displaying the species names. The 3σ (0.2 K) noise level is indicated by horizontal pink lines.
Current usage metrics show cumulative count of Article Views (full-text article views including HTML views, PDF and ePub downloads, according to the available data) and Abstracts Views on Vision4Press platform.
Data correspond to usage on the plateform after 2015. The current usage metrics is available 48-96 hours after online publication and is updated daily on week days.
Initial download of the metrics may take a while.