Fig. 3
Download original image
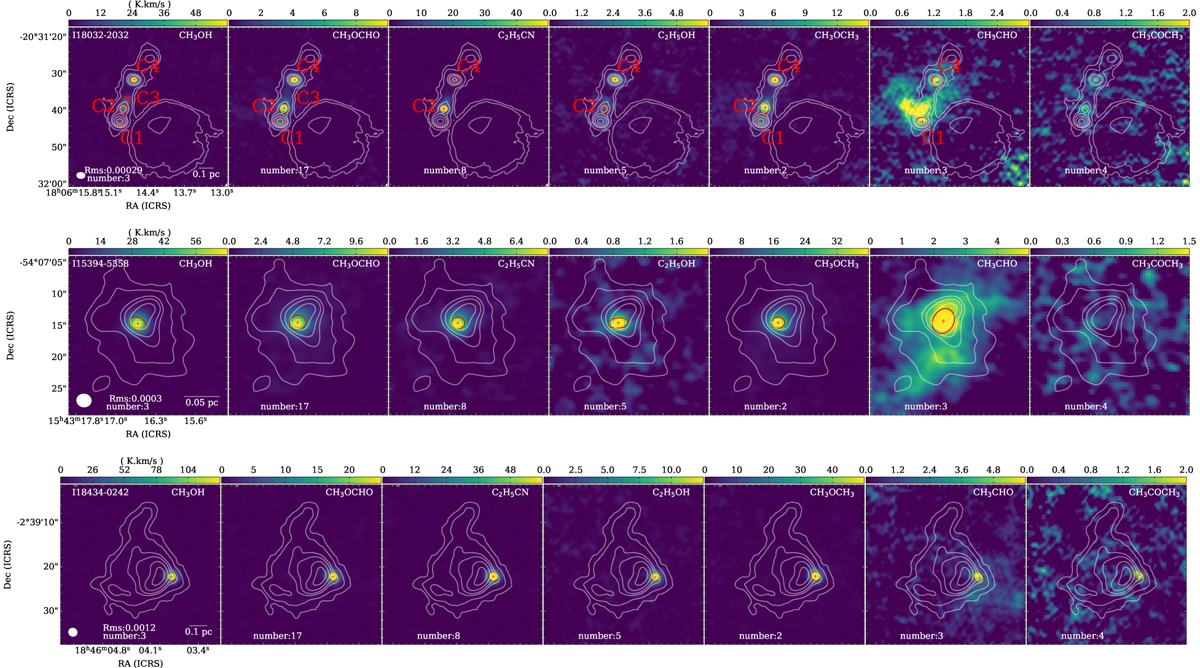
Moment 0 maps of the stacked cubes (Sect. 3.1.5) from three example sources – I18032-2032 (G9.62+0.19), I15394-5358, and I18434-0242 – are shown. The contours represent the continuum emission, with levels of [5, 10, 30, 50, 100, 200] multiplied by the root mean square (rms). The rms value is shown in the lower right corner of the figure (in units of Jansky per beam. The white filled white ellipses in the lower right corners of the left panels represent the beam of continuum emission. The red ellipses indicate the deconvolved FWHM sizes from the twodimensional Gaussian fits to the compact cores. The images for the remaining 83 sources, which contain 94 hot cores and candidates, are presented in Fig. C.1 (on Zenodo).
Current usage metrics show cumulative count of Article Views (full-text article views including HTML views, PDF and ePub downloads, according to the available data) and Abstracts Views on Vision4Press platform.
Data correspond to usage on the plateform after 2015. The current usage metrics is available 48-96 hours after online publication and is updated daily on week days.
Initial download of the metrics may take a while.