Fig. 2
Download original image
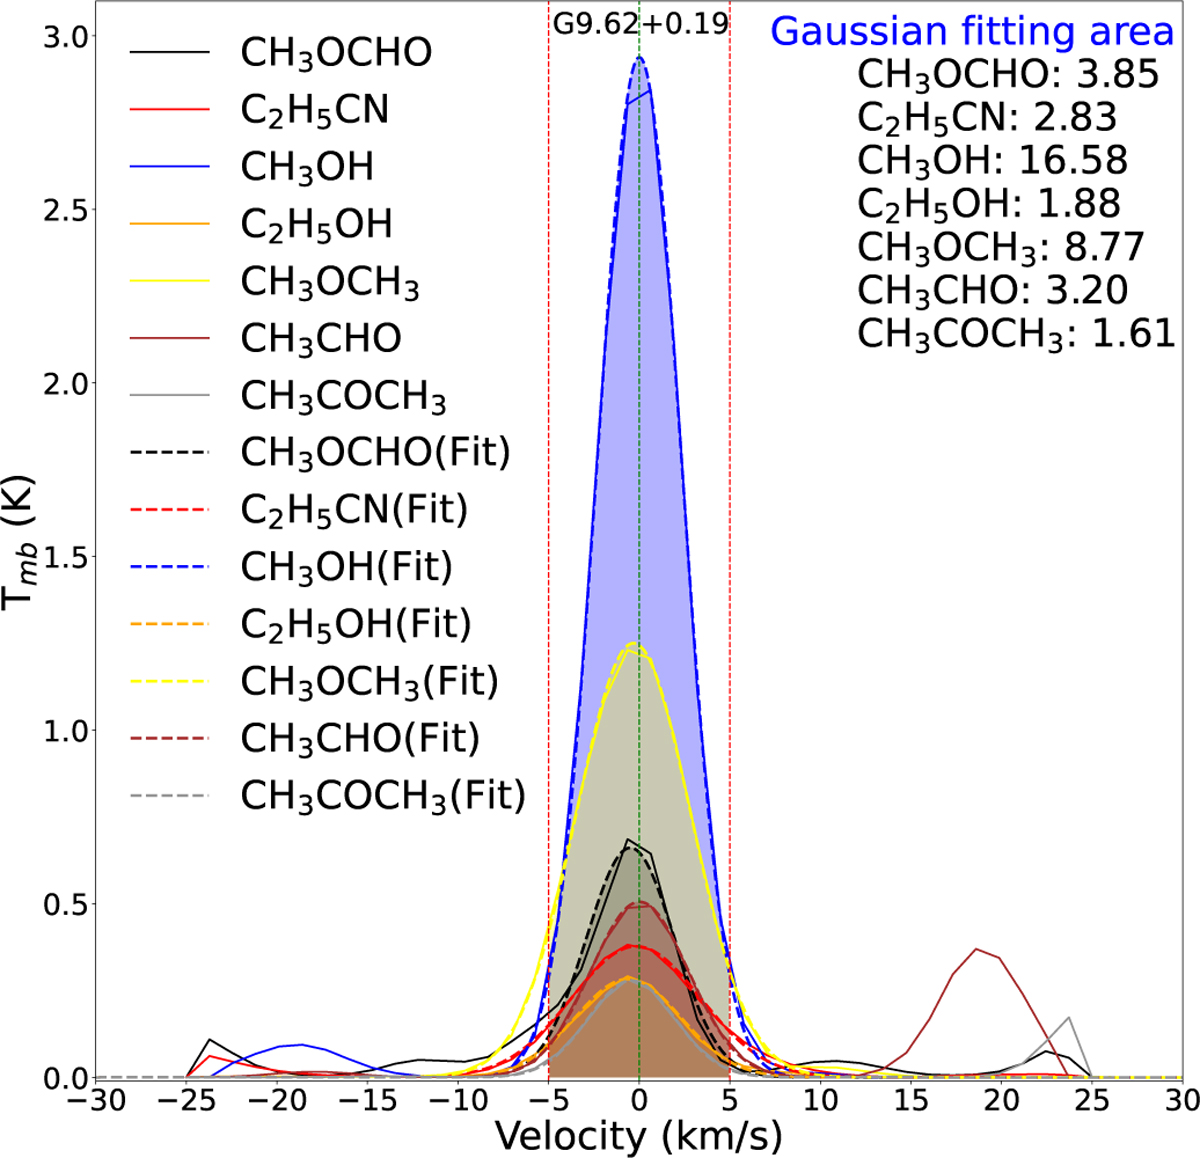
The stacked model spectrum of the seven molecules. The solid lines represent the averaged spectra of the template hot cores in G9.62 +0.19 after spectral stacking. The dashed lines show Gaussian fits to the spectra. The integrated areas of the Gaussian fits (in units of Kelvin kilometers per second) are labeled in the upper right corner. The vertical dotted lines indicate the velocity range of ±5 km/s.
Current usage metrics show cumulative count of Article Views (full-text article views including HTML views, PDF and ePub downloads, according to the available data) and Abstracts Views on Vision4Press platform.
Data correspond to usage on the plateform after 2015. The current usage metrics is available 48-96 hours after online publication and is updated daily on week days.
Initial download of the metrics may take a while.