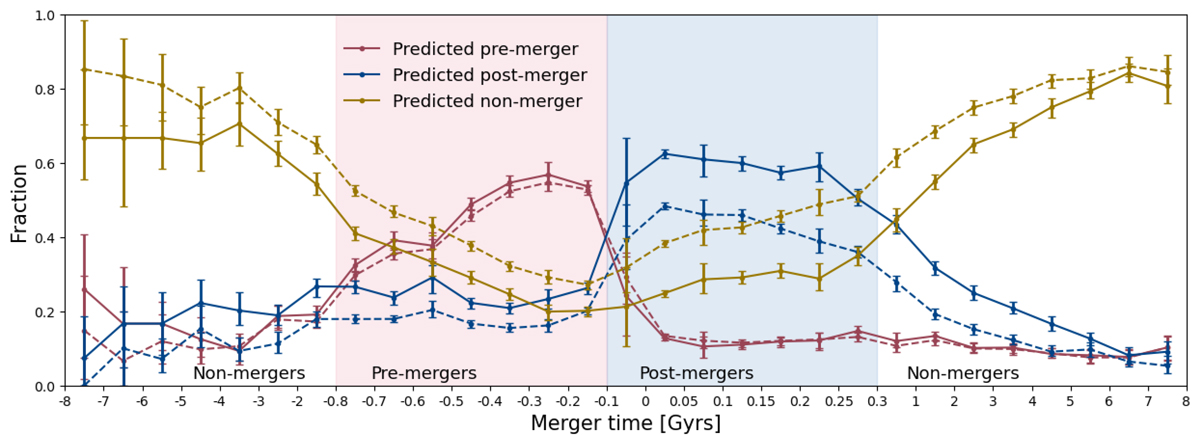
Fig. 7.
Download original image
Fraction of the three predicted classes as a function of merger time before or after coalescence in the regimes of true mergers (blue shaded region: true post-mergers, and pink shaded region: true pre-mergers) and true non-mergers. The x-axis is stretched in the merger regime. The solid lines indicate the results of the one-stage classification set-up. The dashed lines indicate the results of the two-stage classification set-up. The error bars are derived from bootstrap error. For a perfect classifier, the fraction of predicted pre-mergers, post-mergers, or non-mergers would be 100% in the true pre-merger, post-merger, or non-merger region and 0% everywhere else.
Current usage metrics show cumulative count of Article Views (full-text article views including HTML views, PDF and ePub downloads, according to the available data) and Abstracts Views on Vision4Press platform.
Data correspond to usage on the plateform after 2015. The current usage metrics is available 48-96 hours after online publication and is updated daily on week days.
Initial download of the metrics may take a while.