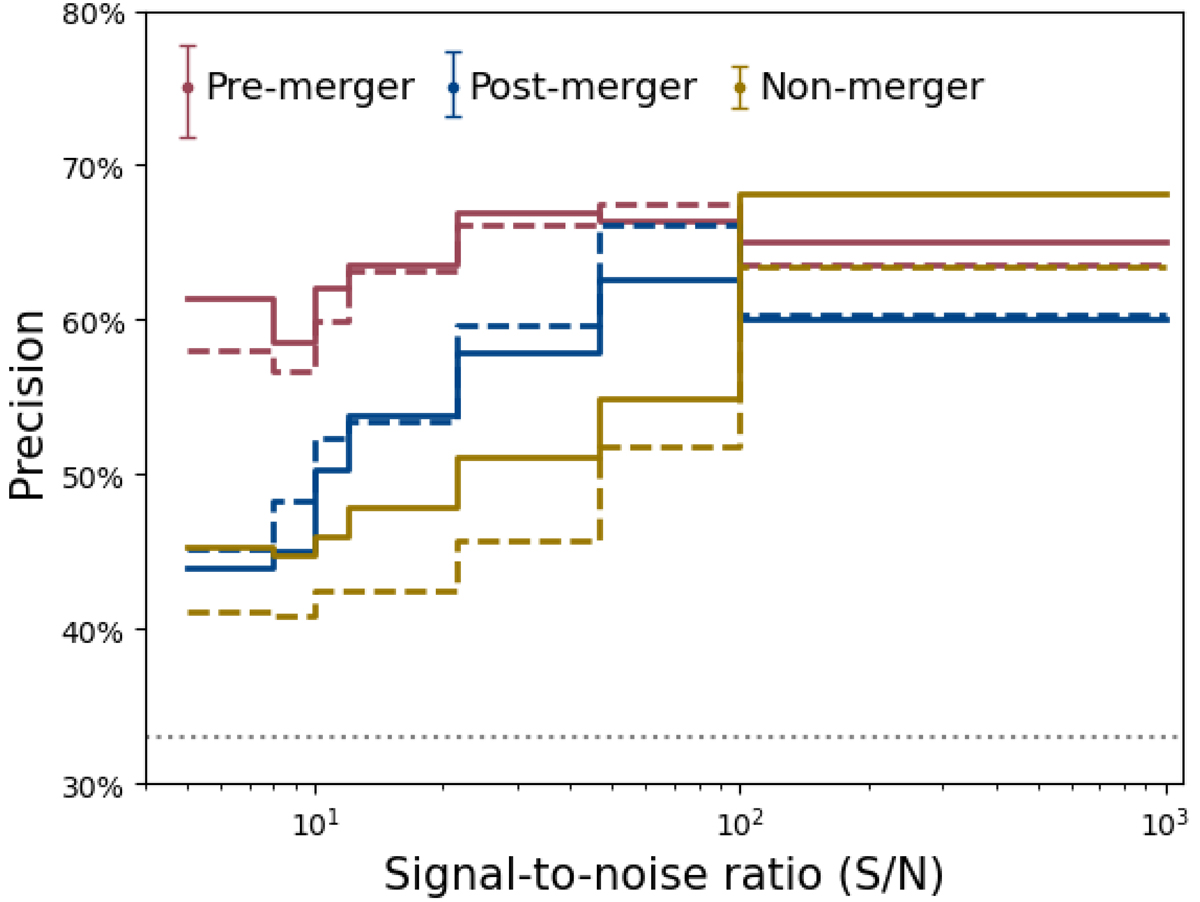
Fig. 4.
Download original image
Precision as a function of S/N for the three classes. The solid lines correspond to the one-stage classification, and the dashed lines correspond to the two-stage classification. The precision levels increase with increasing S/N, but these trends flatten at S/N ≳ 20 for pre- and post-mergers. The mean errors on the precision (derived from bootstrapping) are similar between the one-stage and two-stage set-ups and are indicated in the top left corner. The horizontal dotted line at around 33% corresponds to the precision of a random classifier.
Current usage metrics show cumulative count of Article Views (full-text article views including HTML views, PDF and ePub downloads, according to the available data) and Abstracts Views on Vision4Press platform.
Data correspond to usage on the plateform after 2015. The current usage metrics is available 48-96 hours after online publication and is updated daily on week days.
Initial download of the metrics may take a while.