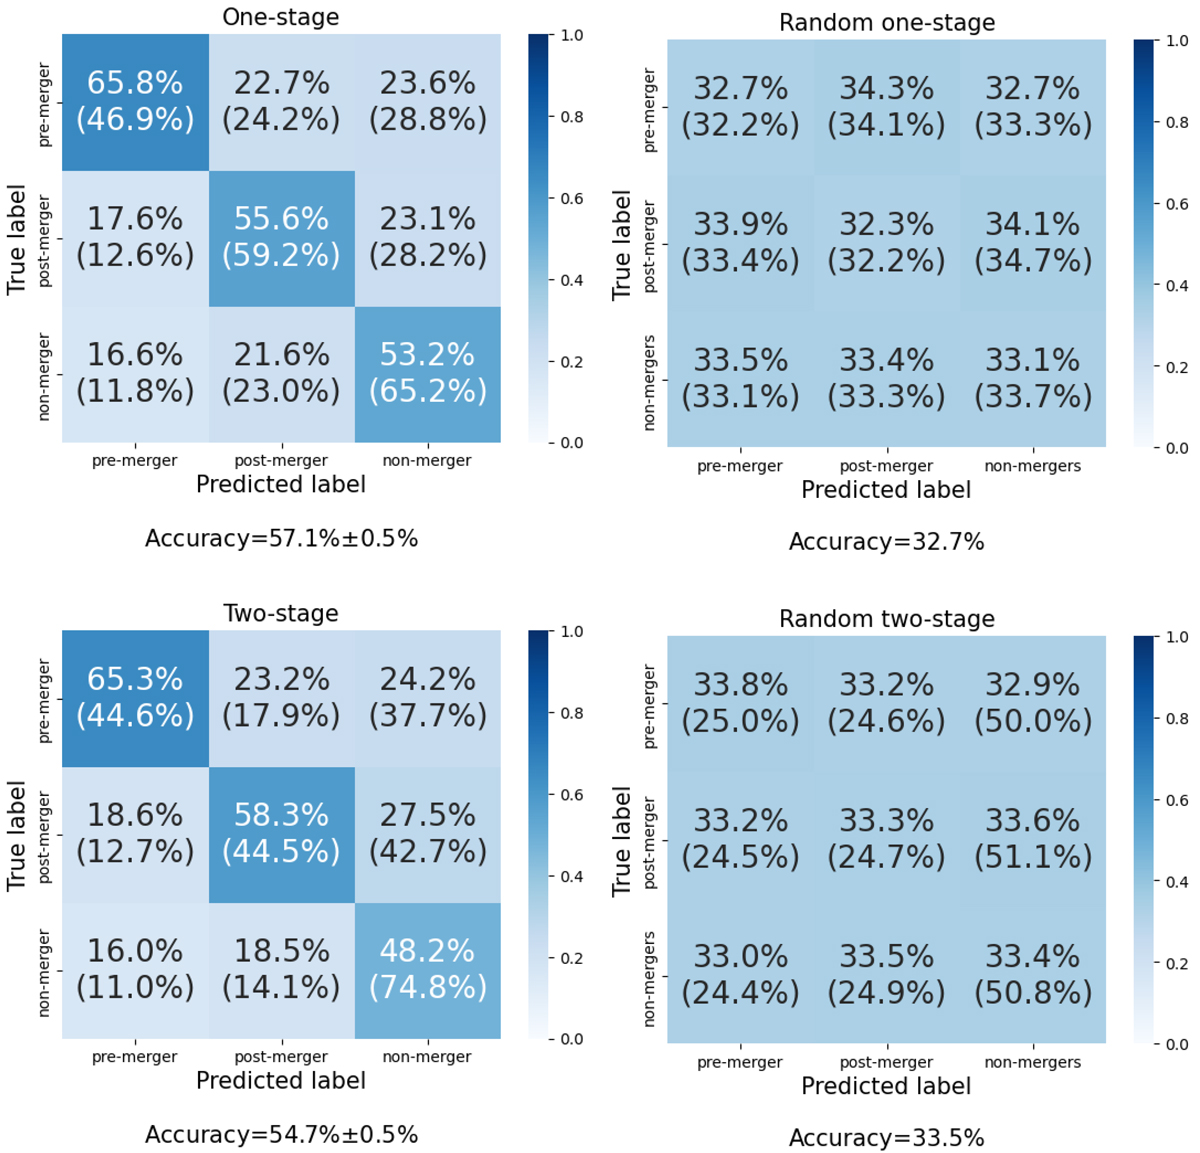
Fig. 3.
Download original image
Top left: Confusion matrix for the one-stage classification, trained and predicted on the entire dataset over all redshifts. The matrix is normalised vertically to give the precision along the diagonal. Recall is shown in brackets below (i.e. the numbers in brackets are normalised horizontally). Top right: Example confusion matrix from a random three-class classifier. Bottom left: Confusion matrix for the two-stage classification. Bottom right: Example confusion matrix from a random classifier in the two-stage set-up. For clarity, only uncertainties on the accuracy metric are shown. The uncertainties on the other metrics are broadly similar.
Current usage metrics show cumulative count of Article Views (full-text article views including HTML views, PDF and ePub downloads, according to the available data) and Abstracts Views on Vision4Press platform.
Data correspond to usage on the plateform after 2015. The current usage metrics is available 48-96 hours after online publication and is updated daily on week days.
Initial download of the metrics may take a while.