Fig. B.1.
Download original image
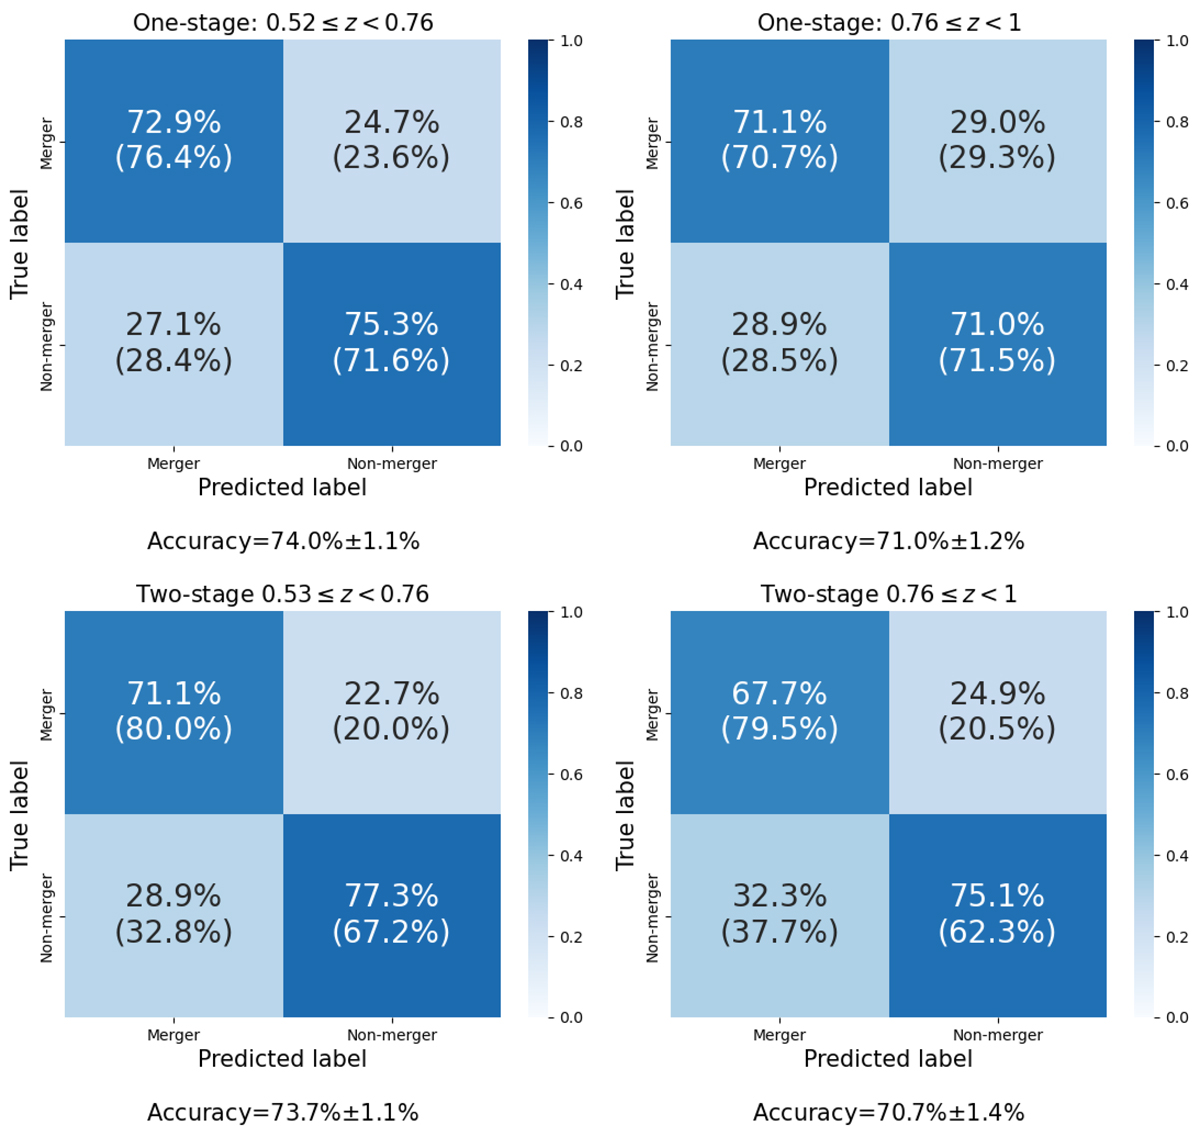
Top left: Confusion matrix for the one-stage classification in the binary classification case (i.e., mergers versus non-mergers), predicted on the dataset in the redshift range 0.52 ≤ z ≤ 0.76. Top right: Similar to the top left figure but for 0.76 ≤ z ≤ 1. Bottom left: Confusion matrix for the two-stage classification in the binary classification case, in the redshift range 0.52 ≤ z ≤ 0.76. Bottom right: Similar to the bottom left figure but for 0.76 ≤ z ≤ 1.
Current usage metrics show cumulative count of Article Views (full-text article views including HTML views, PDF and ePub downloads, according to the available data) and Abstracts Views on Vision4Press platform.
Data correspond to usage on the plateform after 2015. The current usage metrics is available 48-96 hours after online publication and is updated daily on week days.
Initial download of the metrics may take a while.