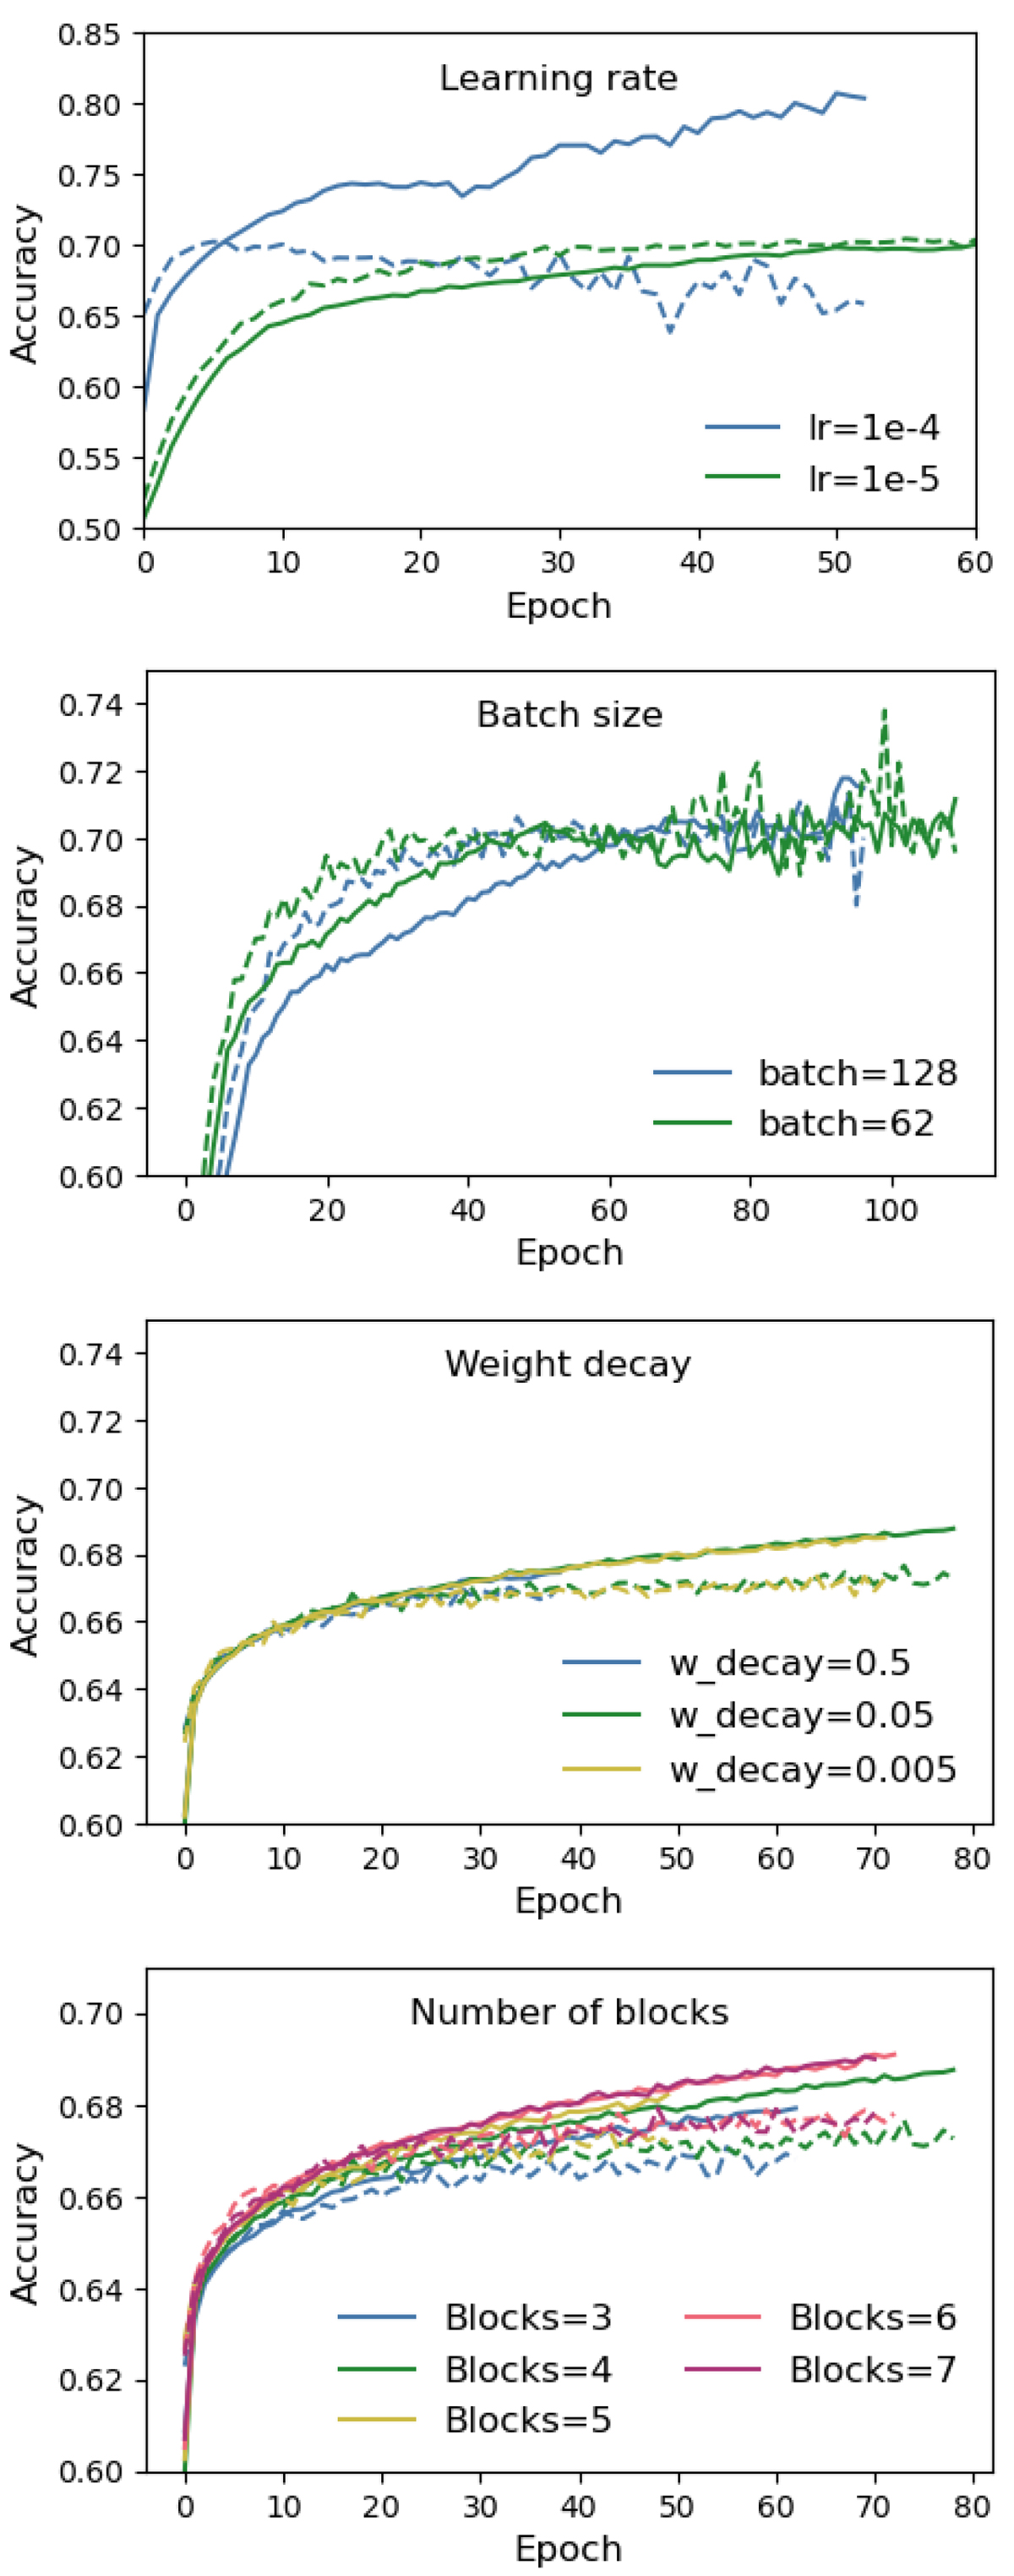
Fig. A.1.
Download original image
Accuracy scores of the merger or non-merger classification versus epoch during the training phase. The first and second panels from the top are the result of the grid search performed on galaxies at low redshifts. The third and fourth panels from the top are the results of training on the entire dataset ranging from z = 0 to 3. The title of each panel indicates the parameter which the runs are grouped on. In other words, each panel shows the average scores of all runs containing the parameter values shown in the legend. From top to bottom, grid searches are grouped on the learning rate, batch size, weight decay, and number of blocks tuned. The solid lines correspond to the training set and the dashed lines correspond to the validation set.
Current usage metrics show cumulative count of Article Views (full-text article views including HTML views, PDF and ePub downloads, according to the available data) and Abstracts Views on Vision4Press platform.
Data correspond to usage on the plateform after 2015. The current usage metrics is available 48-96 hours after online publication and is updated daily on week days.
Initial download of the metrics may take a while.