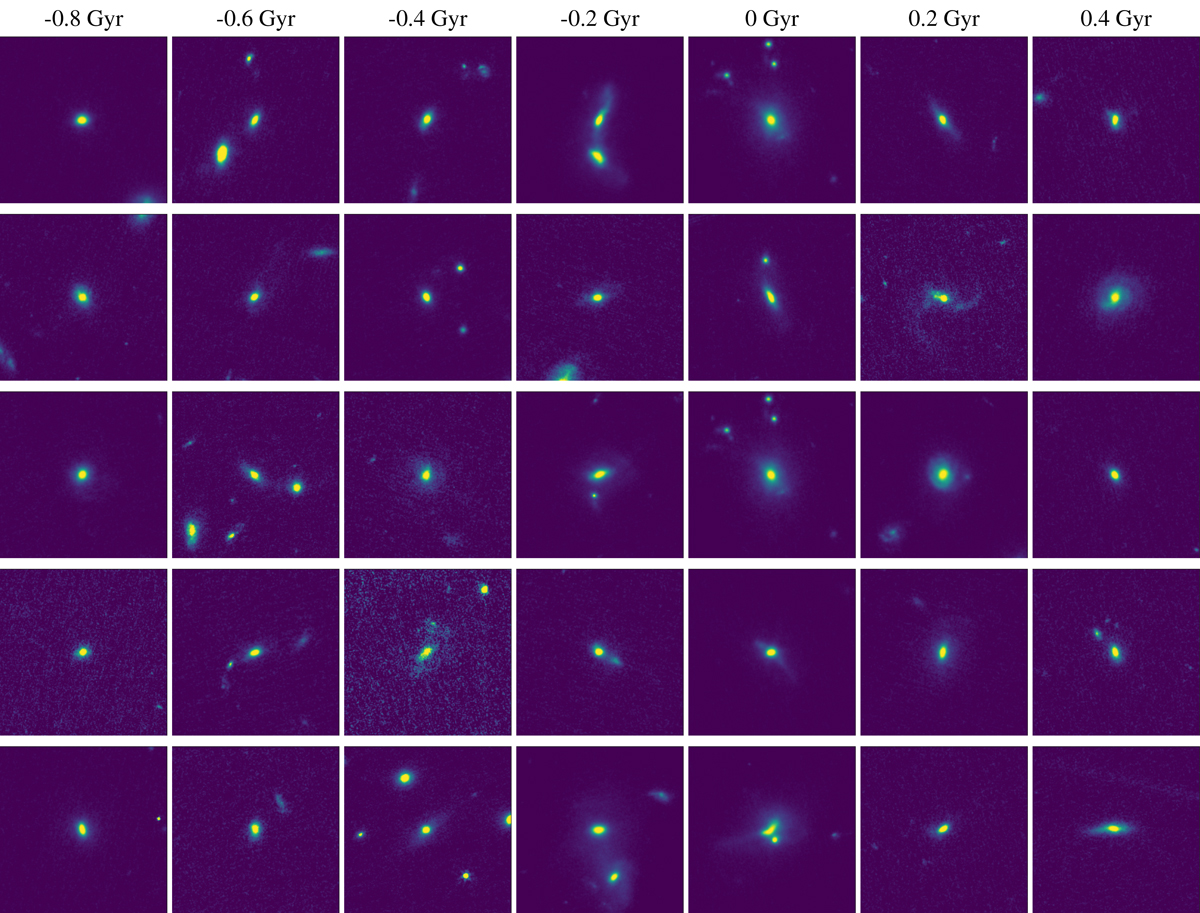
Fig. 1.
Download original image
Five examples of statistical merger sequences selected from the IllustrisTNG simulation. The exact merger time tmerger has been rounded to the nearest 0.1 Gyr. According to our default definition, pre-mergers are those with tmerger between –0.8 and –0.1 Gyr, ongoing mergers are between –0.1 and 0.1 Gyr, and post-mergers are between 0.1 and 0.3 Gyr. Galaxies that do not satisfy these conditions are defined as non-mergers. The cut-outs are 256 × 256 pixels, with a resolution of ∼0.03″ per pixel. The images were scaled using the aggressive arcsinh scaling and were then normalised.
Current usage metrics show cumulative count of Article Views (full-text article views including HTML views, PDF and ePub downloads, according to the available data) and Abstracts Views on Vision4Press platform.
Data correspond to usage on the plateform after 2015. The current usage metrics is available 48-96 hours after online publication and is updated daily on week days.
Initial download of the metrics may take a while.