Fig. A.1.
Download original image
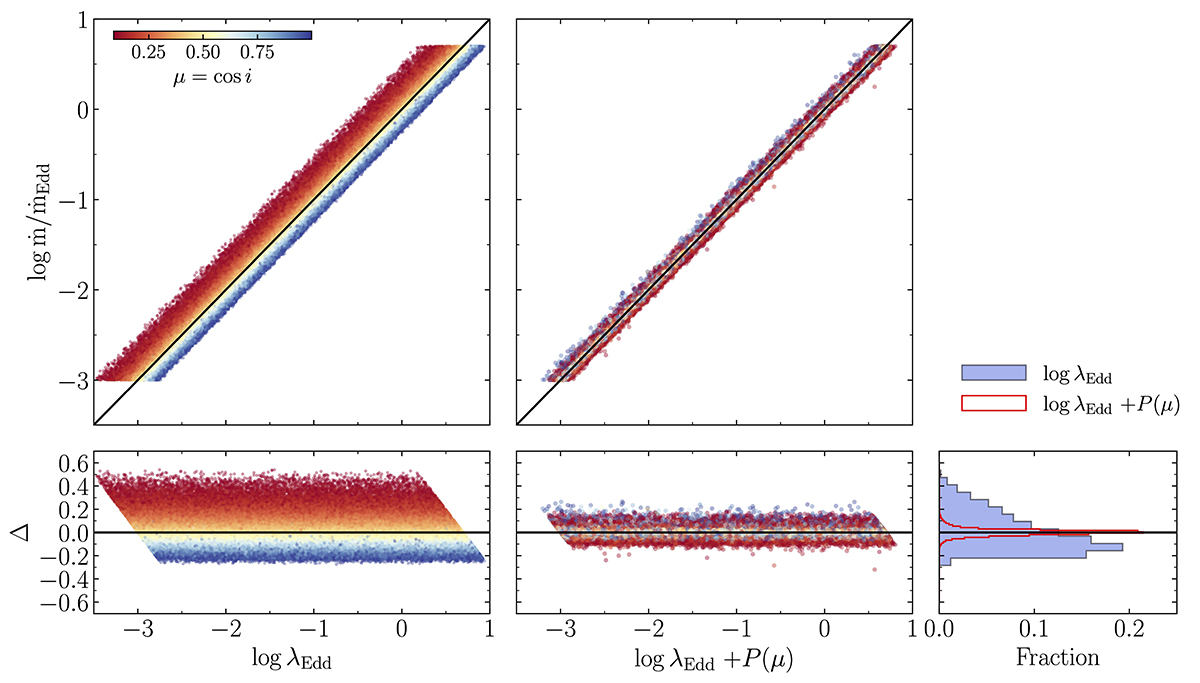
Left: Accretion rate (log ṁ/ṁEdd) as a function of the Eddington ratio (log λEdd). The solid line show the identity line. The bottom panel shows the difference between log ṁ/ṁEdd and the identity line. Middle: Same but replacing the x-axis with the sum of log λEdd and a polynomial function of the inclination angle to account for the anisotropy in the emission (see text for more details). The colour maps corresponds to μ = cos i. Bottom right: Distribution of the differences between the y-axis and the x-axis in the left and middle panels (blue and red histograms, respectively)
Current usage metrics show cumulative count of Article Views (full-text article views including HTML views, PDF and ePub downloads, according to the available data) and Abstracts Views on Vision4Press platform.
Data correspond to usage on the plateform after 2015. The current usage metrics is available 48-96 hours after online publication and is updated daily on week days.
Initial download of the metrics may take a while.