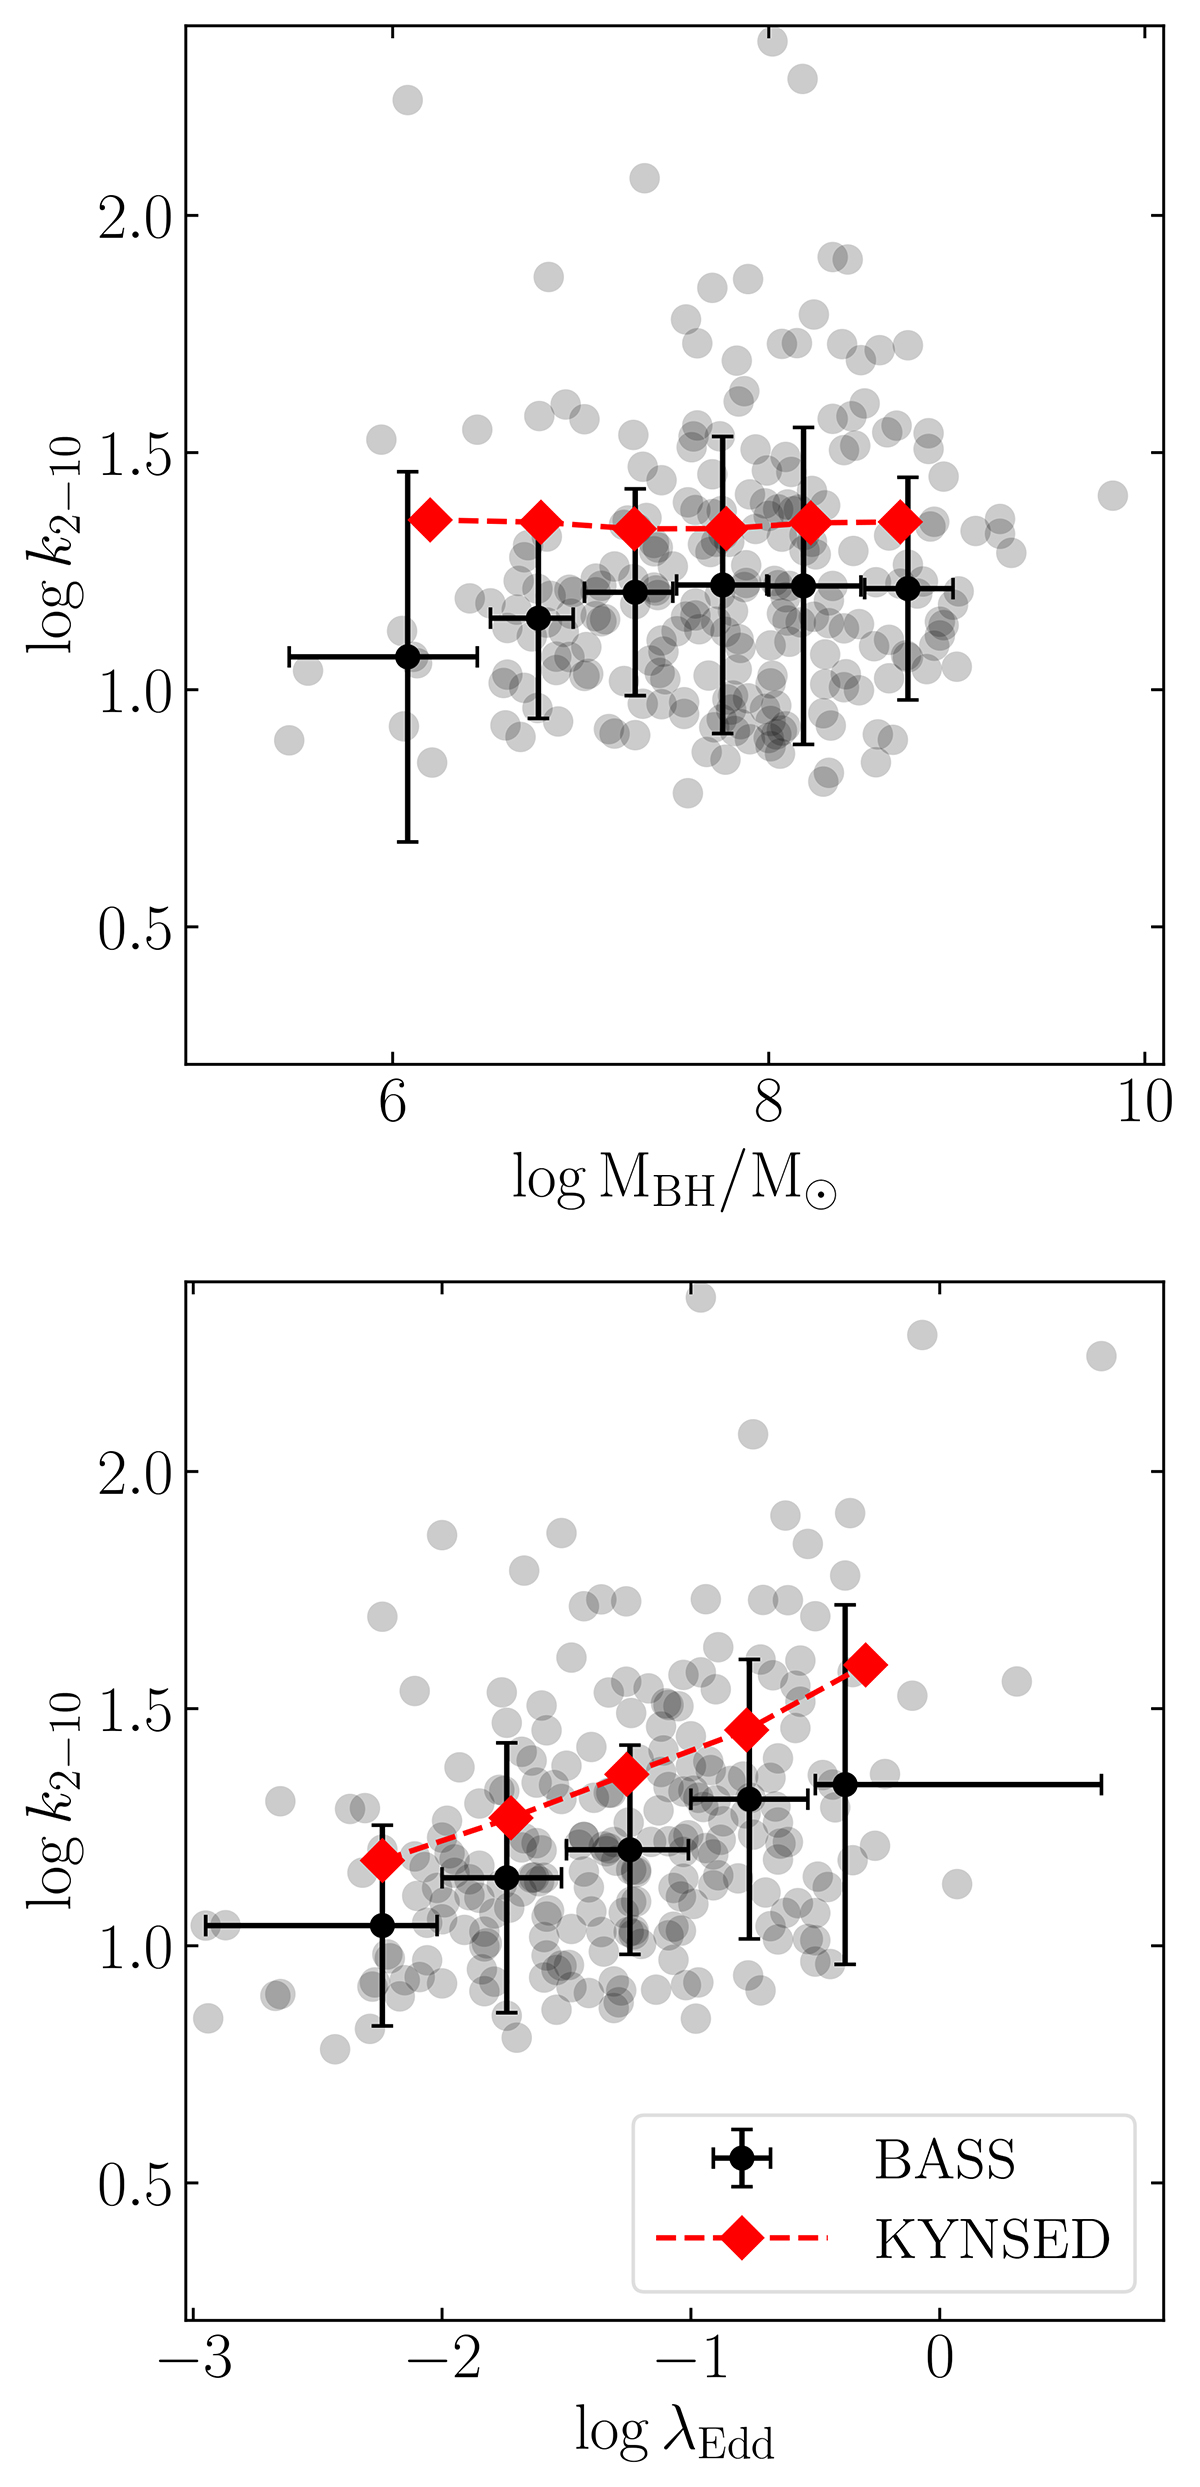
Fig. 6.
Download original image
X-ray bolometric correction as a function of MBH (top) and λEdd (bottom). The grey circles correspond to the data points from BASS (Gupta et al. 2024). The black circles show the same data, but binned along the x-axis. We also show k2−10 as a function of MBH and λEdd for the model SEDs that agree with the observed L2−10 keV–L2500 Å correlation obtained by matching the distributions of MBH and λEdd to those of the BASS sample (red diamonds).
Current usage metrics show cumulative count of Article Views (full-text article views including HTML views, PDF and ePub downloads, according to the available data) and Abstracts Views on Vision4Press platform.
Data correspond to usage on the plateform after 2015. The current usage metrics is available 48-96 hours after online publication and is updated daily on week days.
Initial download of the metrics may take a while.