Fig. 8.
Download original image
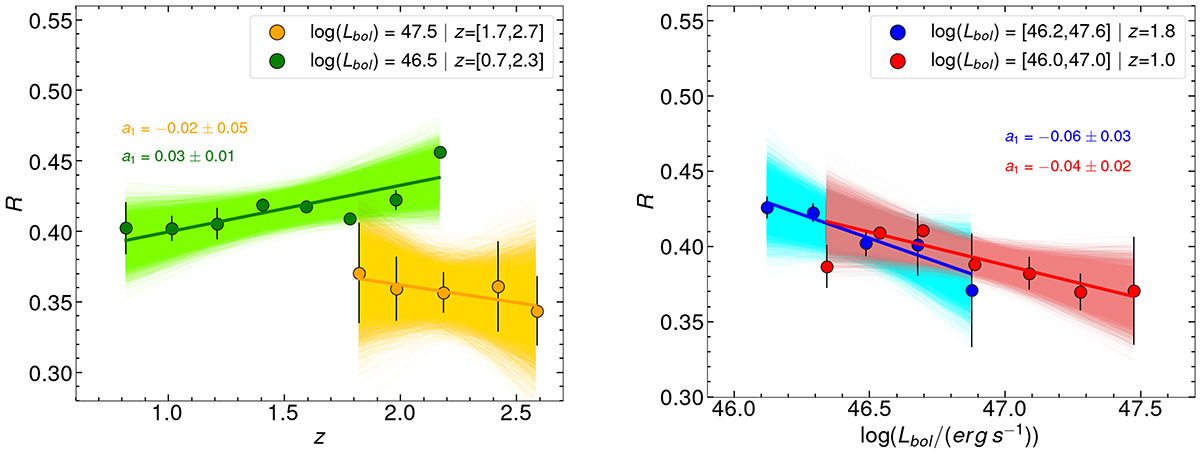
z–R (left panel) and log(Lbol)–R (right panel) section of the parameter space for the bins denoted by rectangles with the same colour-coding in Fig. 7. The solid lines represent the best linear fits to the data, while the shaded areas, obtained by resampling the posterior distributions of the best fit parameters, mark the 95% confidence intervals.
Current usage metrics show cumulative count of Article Views (full-text article views including HTML views, PDF and ePub downloads, according to the available data) and Abstracts Views on Vision4Press platform.
Data correspond to usage on the plateform after 2015. The current usage metrics is available 48-96 hours after online publication and is updated daily on week days.
Initial download of the metrics may take a while.