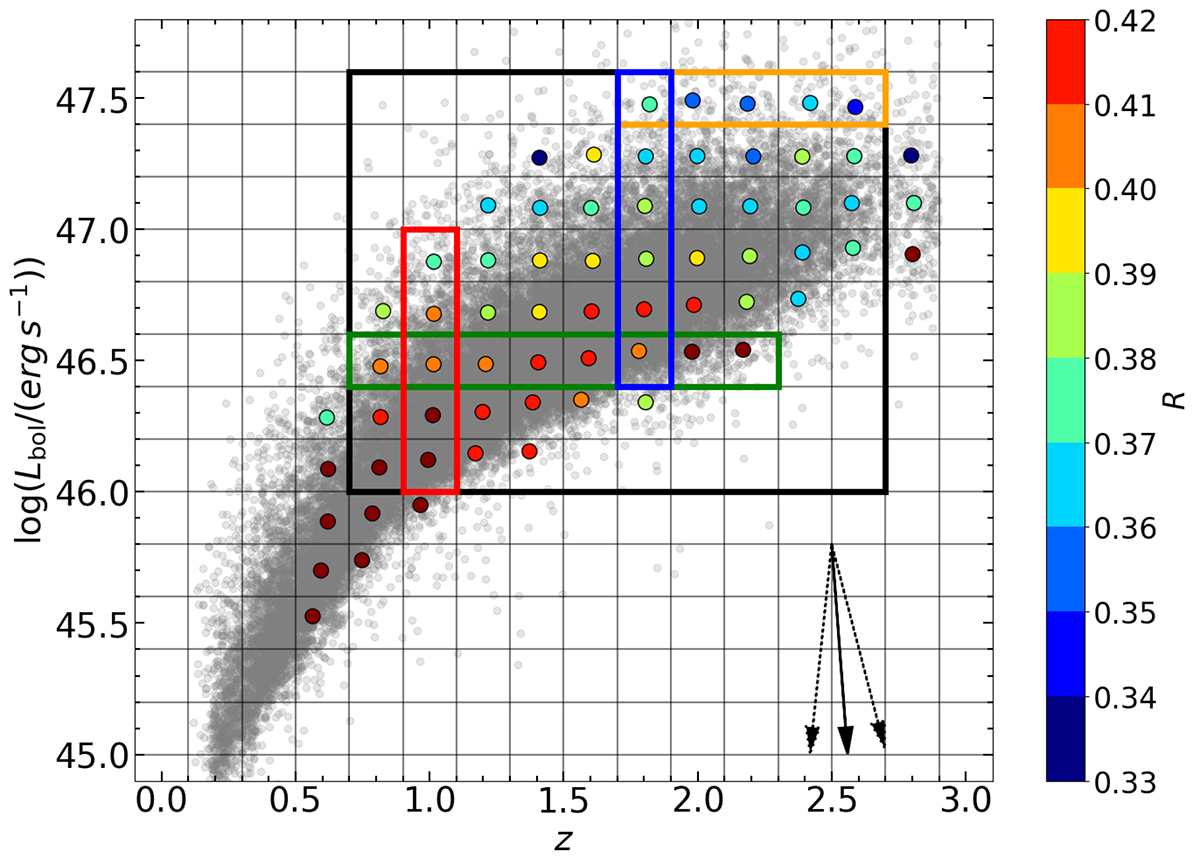
Fig. 7.
Download original image
log(Lbol)–z plane with R shown as coloured dots (see colour bar at right). The black arrow points in the direction given by the PCA, evaluated in the bins within the black rectangle, while the dashed arrows show the uncertainty on the direction. The coloured rectangles highlight the bins of the parameter space shown in Fig. 8. We recall that the bins between 46.4 ≤ log(Lbol)≤47.4 and 1.0 ≤ z ≤ 2.8 are included in the SED evolution analysis described in Sect. 4.1.
Current usage metrics show cumulative count of Article Views (full-text article views including HTML views, PDF and ePub downloads, according to the available data) and Abstracts Views on Vision4Press platform.
Data correspond to usage on the plateform after 2015. The current usage metrics is available 48-96 hours after online publication and is updated daily on week days.
Initial download of the metrics may take a while.