Fig. 5.
Download original image
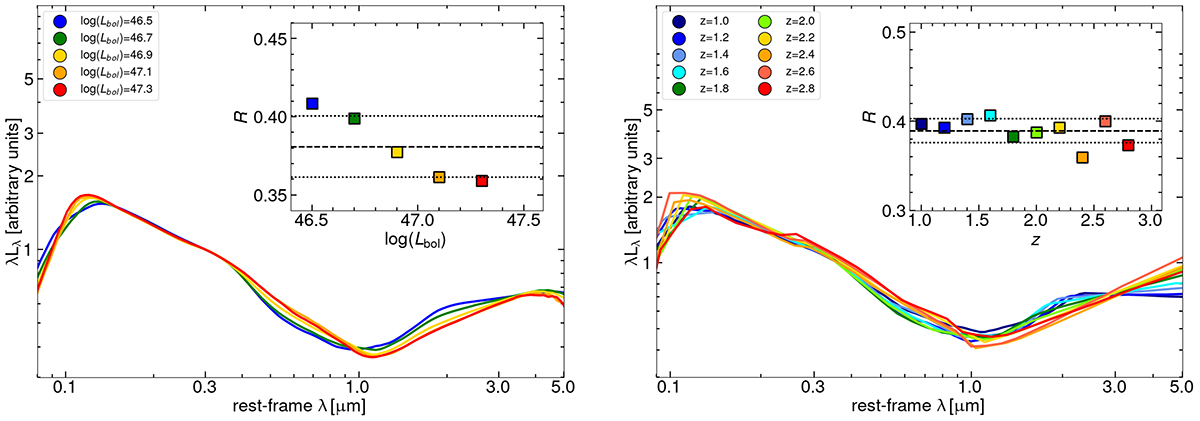
Left: Sequence of average SEDs for increasing luminosity, scaled by their total luminosity between 1000 Å and 1 μm. The trend of decreasing NIR luminosity for increasing optical luminosity is apparent despite the small dynamical range, and it is testified by the decreasing R shown in the inset. Here the mean value (standard deviation) is shown as a black solid (dashed) line. Right: Sequence of average SEDs for increasing redshift, scaled by their total luminosity between 1000 Å and 1 μm. The different sampling of the rest-frame emission leads to slightly different SEDs. However, on average R does not show any evolutionary trend as we do not observe systematic departures from the mean value.
Current usage metrics show cumulative count of Article Views (full-text article views including HTML views, PDF and ePub downloads, according to the available data) and Abstracts Views on Vision4Press platform.
Data correspond to usage on the plateform after 2015. The current usage metrics is available 48-96 hours after online publication and is updated daily on week days.
Initial download of the metrics may take a while.