Fig. 4.
Download original image
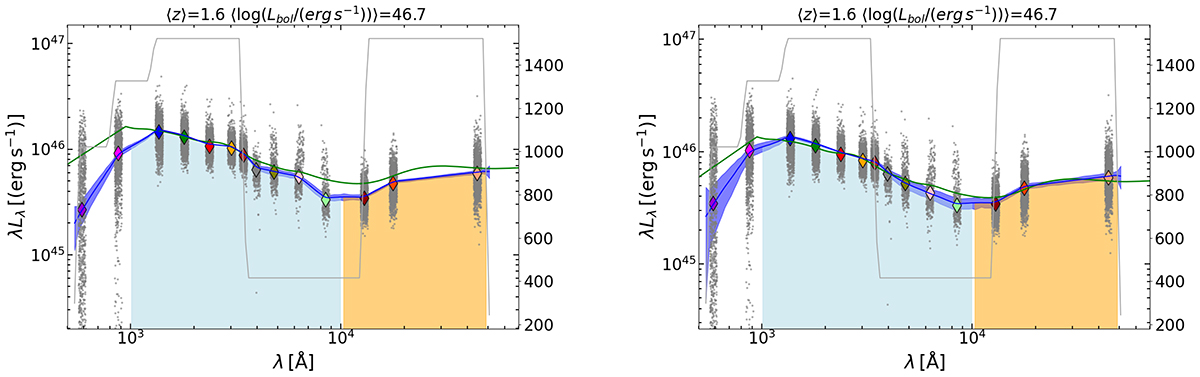
Example of average SEDs produced employing the uncorrected (left) and corrected (right) photometry (blue). The effect of the corrections applied is to increase the flux bluewards of the Lyα and reduce the optical and UV Fe II bumps. In addition, the strong Hα emission in the observed-frame H band (pink) is reduced in the corrected data-set. The grey clouds of points are the photometric data used to produce the SED; the coloured diamonds (same colour-code as in left panel of Fig. 3) are the median luminosities. The solid grey line represents the number of objects contributing to each spectral channel. The average quasar SED from Krawczyk et al. (2013), scaled to the 3000 Å total luminosity, is shown in green as a comparison. The light blue and orange shaded areas represent the regions where the Lopt and the LNIR terms in the covering factor proxy R are respectively evaluated (see Sect. 3.5). The average z and log(Lbol) of the parameter space represented by these SEDs are denoted in the top string.
Current usage metrics show cumulative count of Article Views (full-text article views including HTML views, PDF and ePub downloads, according to the available data) and Abstracts Views on Vision4Press platform.
Data correspond to usage on the plateform after 2015. The current usage metrics is available 48-96 hours after online publication and is updated daily on week days.
Initial download of the metrics may take a while.