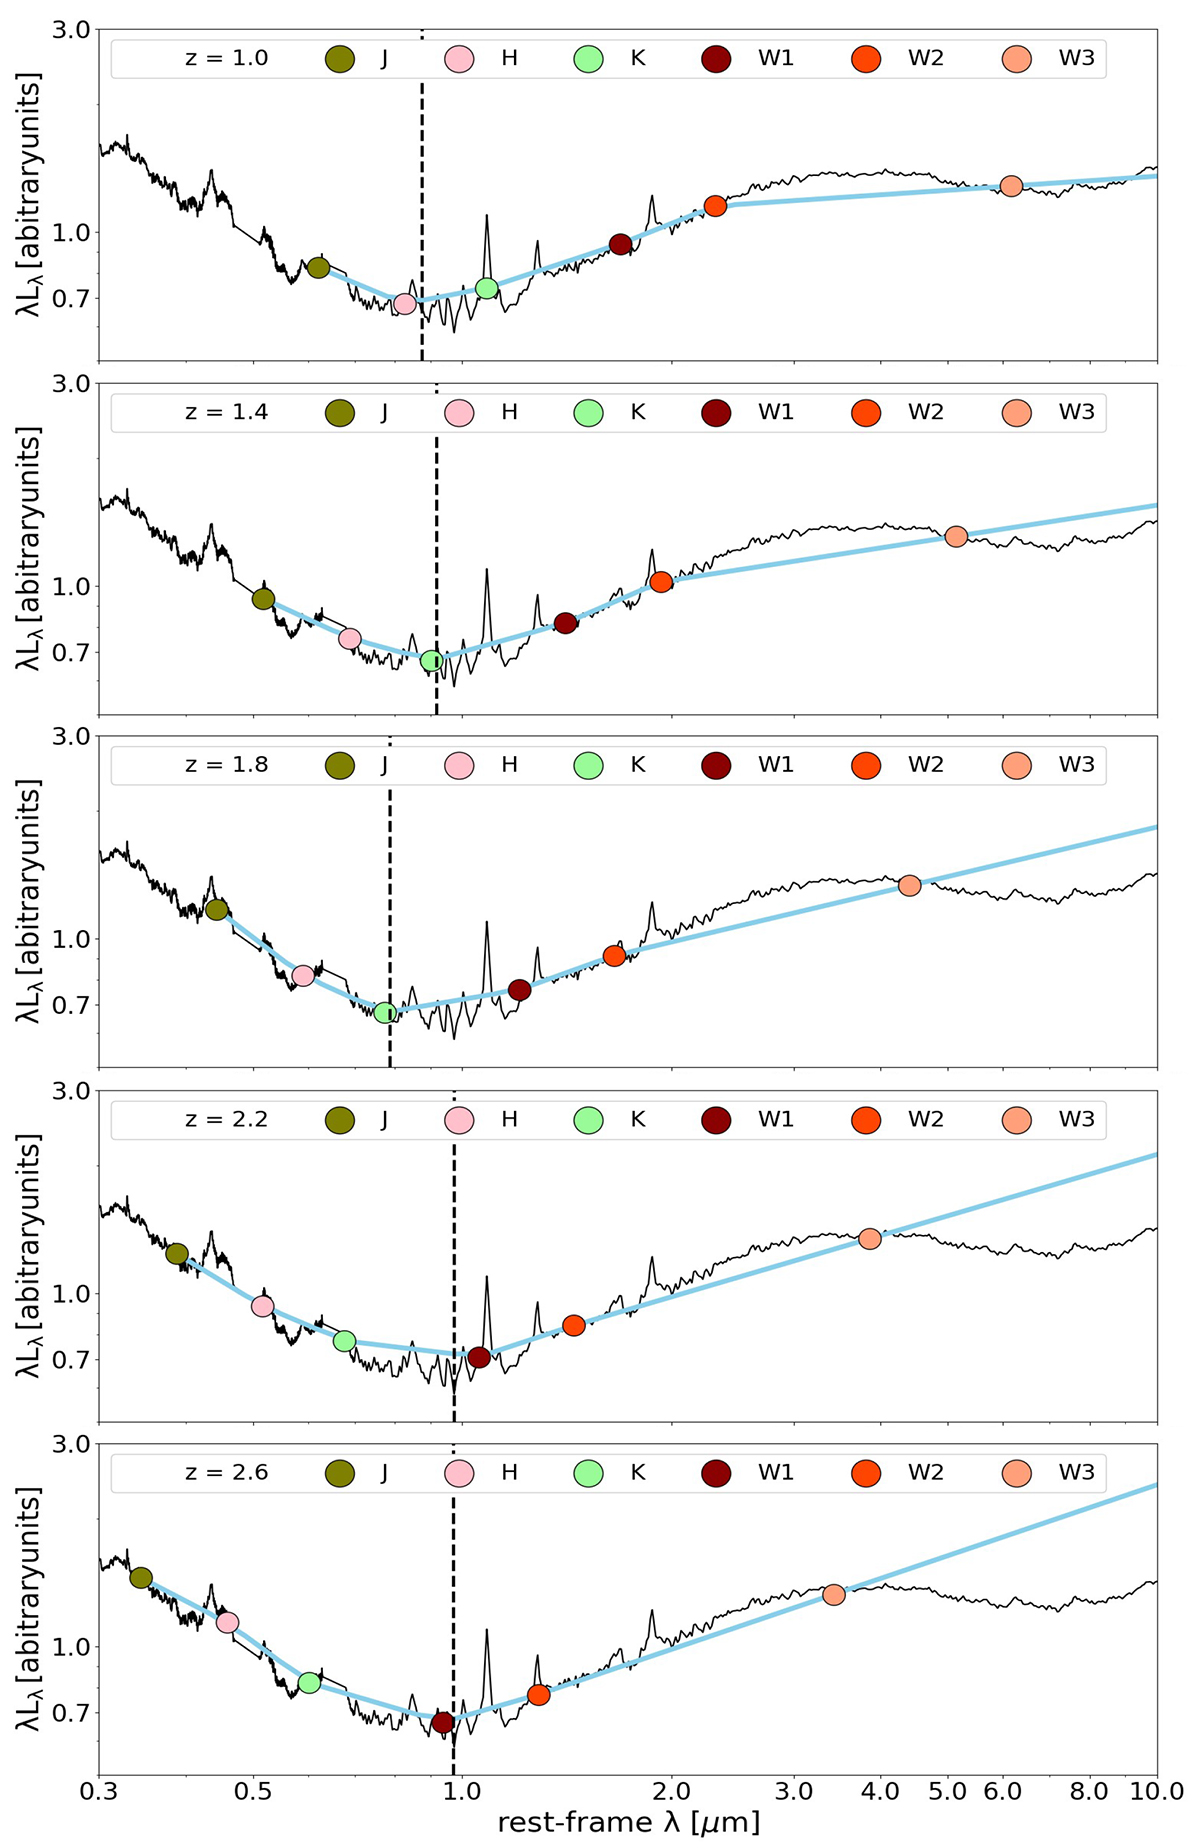
Fig. B.1.
Download original image
Effect of photometric sampling on the 1 μm dip and the NIR bump, here represented by the Hernán-Caballero et al. (2016) template (black), across the infrared filters (see legend) for increasing z. The light blue line represents the interpolated/extrapolated SED through the photometric points. The vertical dashed line marks the position of the minimum of the photometric SED.
Current usage metrics show cumulative count of Article Views (full-text article views including HTML views, PDF and ePub downloads, according to the available data) and Abstracts Views on Vision4Press platform.
Data correspond to usage on the plateform after 2015. The current usage metrics is available 48-96 hours after online publication and is updated daily on week days.
Initial download of the metrics may take a while.