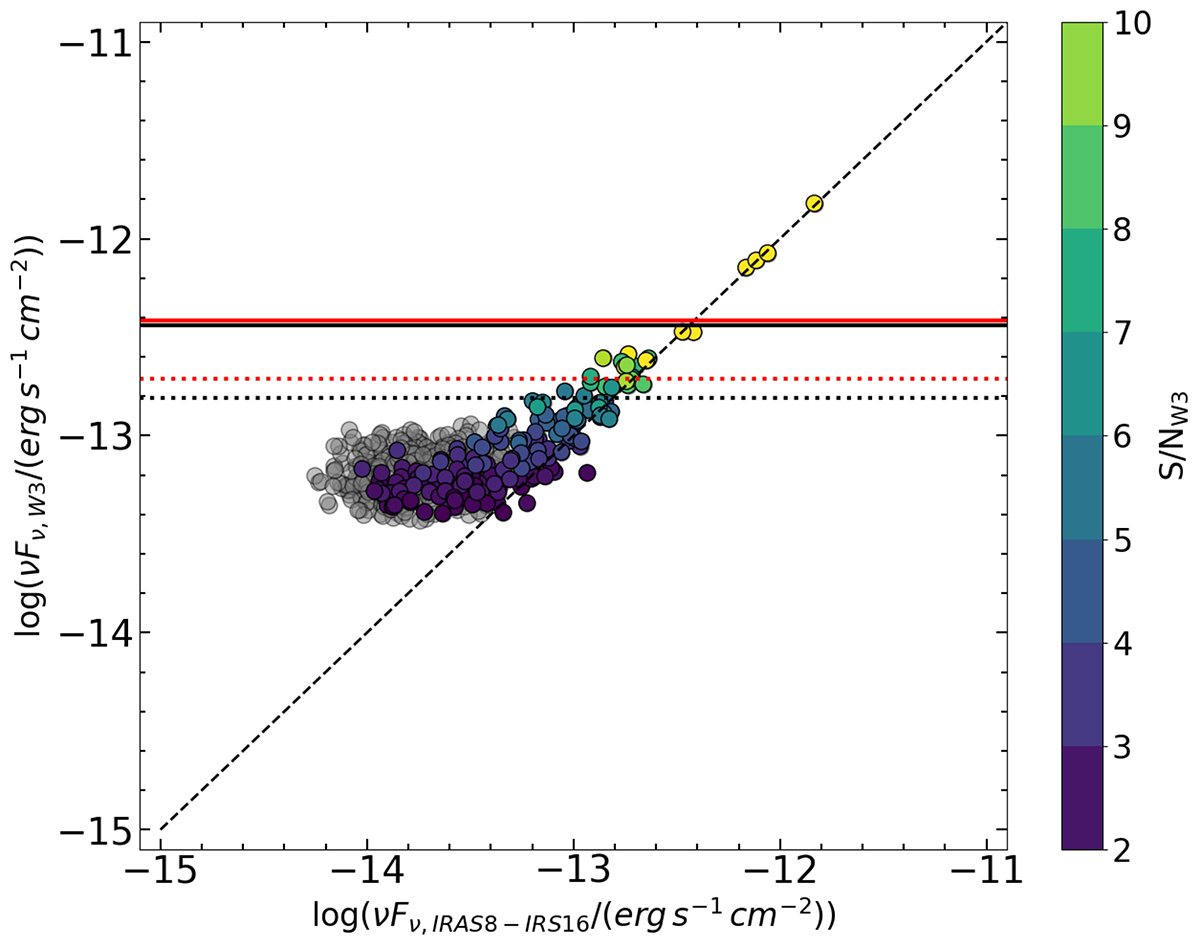
Fig. A.2.
Download original image
Comparison between the 12 μm fluxes interpolated between Spitzer IRAC 8 μm and IRS 16 μm and WISE W3, also showing the W3 S/N (see colour bar at right). The grey dots denote sources below the W3 S/N = 2 threshold chosen in this work. The black solid (dotted) horizontal line marks the median (lowest 5 th percentile) flux for the objects in our sample without performing the quality cuts described in the text. The same holds for the red lines where also the S/N≥2 cut is applied. Although there is a trail of points detaching from the one-to-one relation at low S/N W3 (∼4–5), roughly 95% of our sample has fluxes higher than the threshold where W3 starts to systematically overestimate the Spitzer measurements. The colour-code of the lines is the same as in Fig.A.1.
Current usage metrics show cumulative count of Article Views (full-text article views including HTML views, PDF and ePub downloads, according to the available data) and Abstracts Views on Vision4Press platform.
Data correspond to usage on the plateform after 2015. The current usage metrics is available 48-96 hours after online publication and is updated daily on week days.
Initial download of the metrics may take a while.