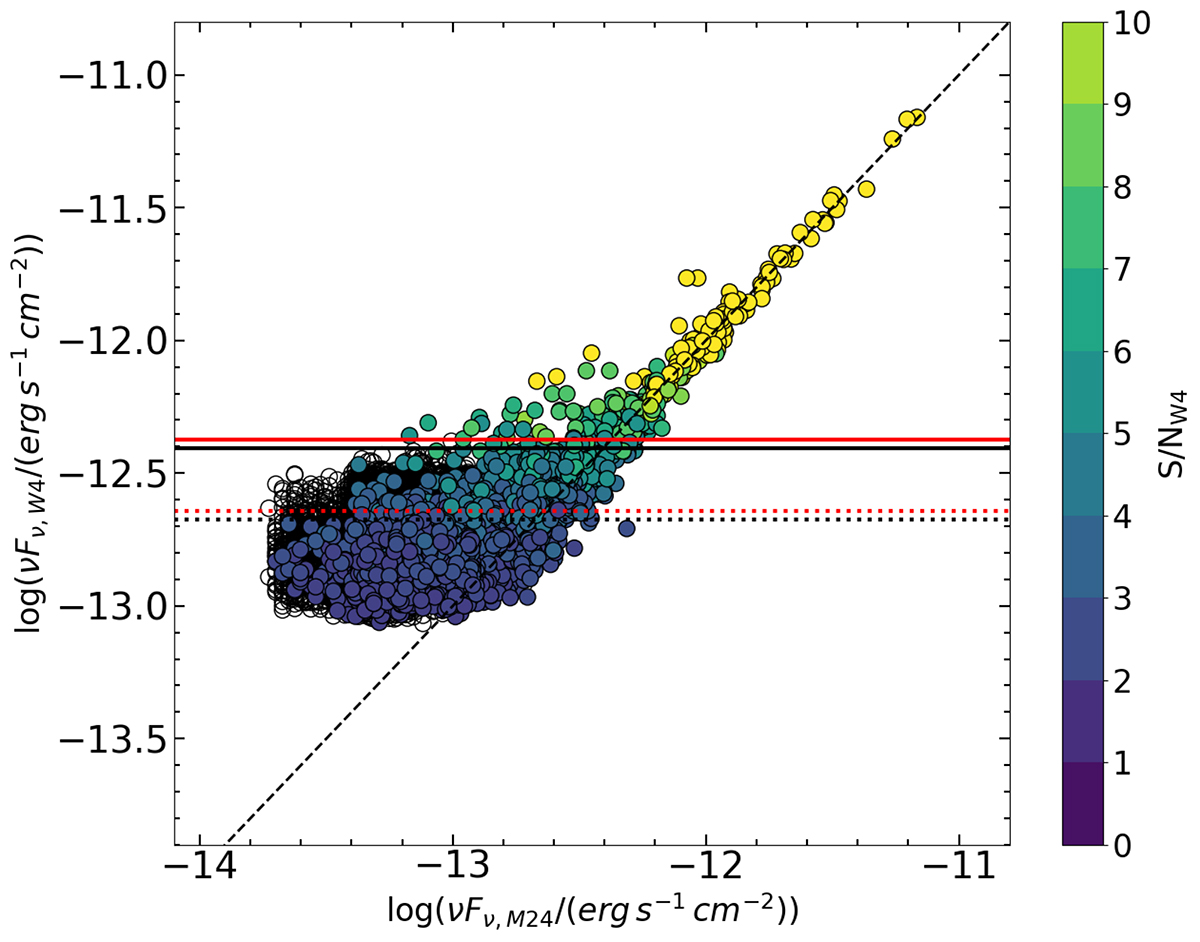
Fig. A.1.
Download original image
Comparison between Spitzer MIPS24 and WISE W4 photometry as a function of W4 S/N (see colour bar at right). The open circles in the background denote upper limits. W4 measurements systematically overestimate the actual fluxes at low S/N. The black solid (dotted) horizontal line marks the median (lowest 5 th percentile) flux for the objects in our sample without performing the quality cuts described in the text. The same holds for the red lines where the S/N≥2 cut is also applied. A significant amount of our sources would have systematically overestimated W4 fluxes.
Current usage metrics show cumulative count of Article Views (full-text article views including HTML views, PDF and ePub downloads, according to the available data) and Abstracts Views on Vision4Press platform.
Data correspond to usage on the plateform after 2015. The current usage metrics is available 48-96 hours after online publication and is updated daily on week days.
Initial download of the metrics may take a while.