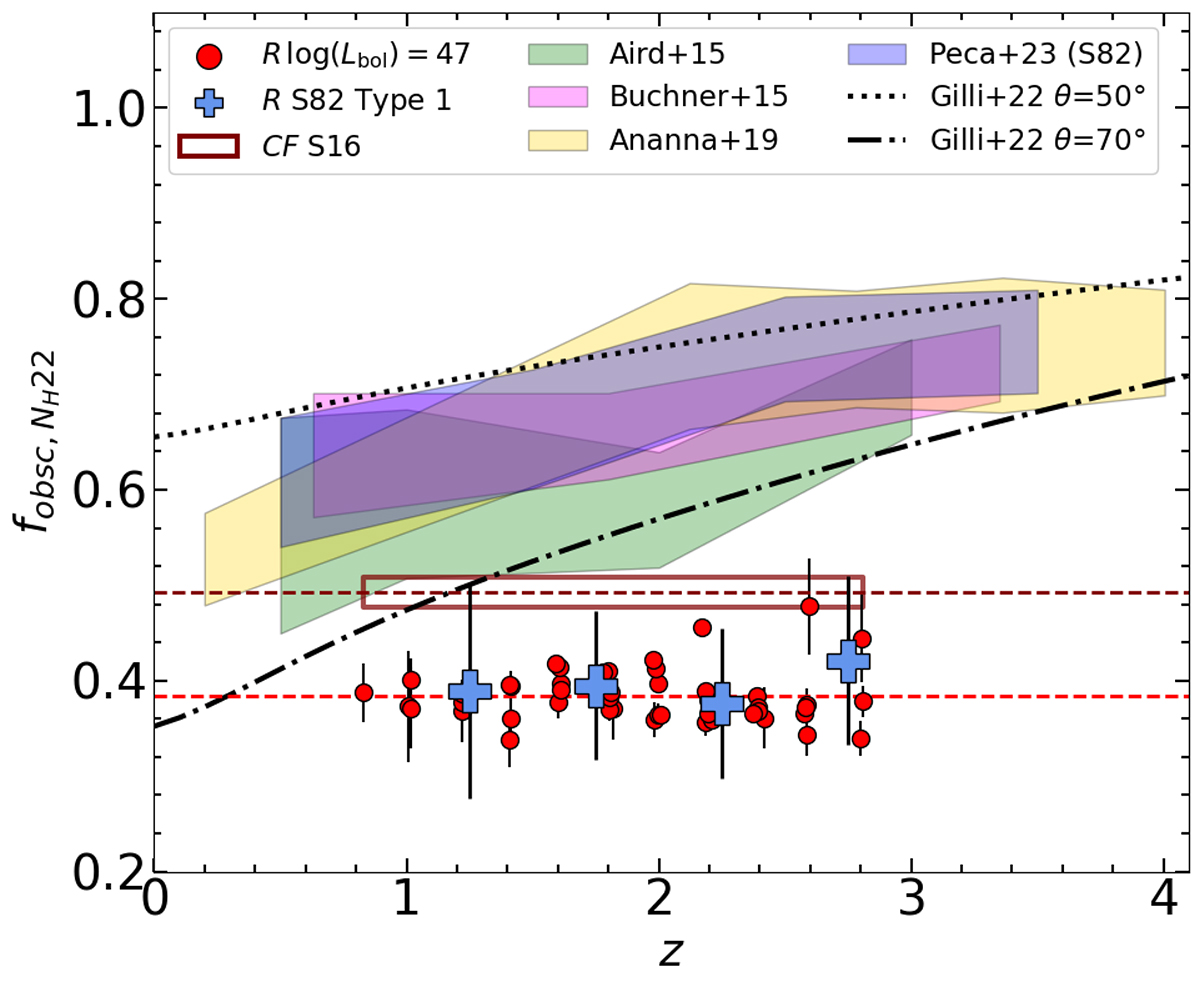
Fig. 12.
Download original image
Obscured AGN fraction with NH > 1022 cm−2 as a function of redshift in different literature samples (Aird et al. 2015; Buchner et al. 2015; Ananna et al. 2019; Peca et al. 2023), including a correction for Compton-thick sources (see text for details). The data derived from the sources at log(Lbol)∼47 in our sample are shown as red dots. The S82 quasars in the same luminosity range exhibit similar values of R. The hollow rectangle shows the values covered by the CF derived according to the Stalevski et al. (2016) prescription. The average of the measured values and the inferred values are both extrapolated at the redshifts not directly covered by our bins at log(Lbol)∼47 as shown by the dashed lines. The black dotted and dash-dotted lines correspond to the Gilli et al. (2022) models for δ = 3.3, γ = 2.0, and, respectively, θ = 50° and 70°.
Current usage metrics show cumulative count of Article Views (full-text article views including HTML views, PDF and ePub downloads, according to the available data) and Abstracts Views on Vision4Press platform.
Data correspond to usage on the plateform after 2015. The current usage metrics is available 48-96 hours after online publication and is updated daily on week days.
Initial download of the metrics may take a while.